

Key insights:
- Chainlink broke above a massive falling wedge pattern, but the price was not looking robustly bullish as the weekly candle was now red suggesting indecision.
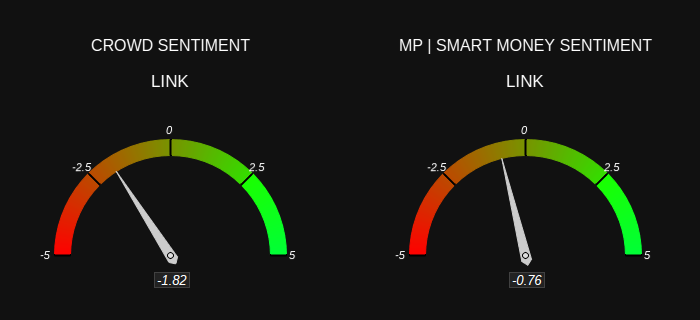
- Both of the participants, Smart Money and the Crowd, exhibited bearish sentiment.
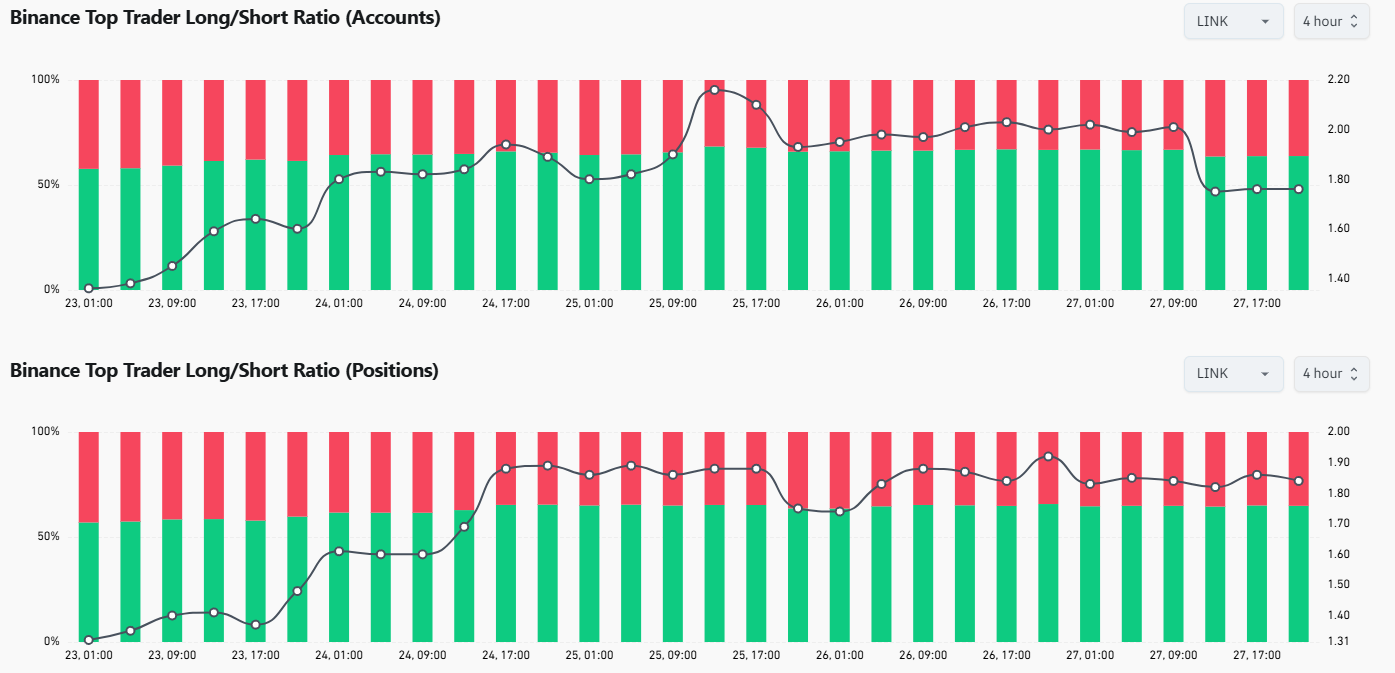
- LINK’s Binance Top Trader Long/Short Ratio indicated a significant movement of increased long position holdings.
A Chainlink (LINK) price prediction analysis showed it exceeded its descending wedge structure, which had governed its price movements since reaching $30.87.
Chainlink Price Prediction
This bullish breakout showed signs of buyer reluctance as the weekly candle forming was red at $14.23.
Historical analysis of falling wedges indicated they point towards price reversals but inadequate price momentum over $16.00 indicated market hesitation.
The $16 price level appeared as a possible point of immediate resistance yet support within the breakout zone near $12 might function as a protecting force.
A warning concerning the state of the market was sent out by the MACD indicator.
The negative turn of the MACD line (-1.00) reflected in the histogram because it remained negative at -0.60 and the signal line stayed at -0.40.
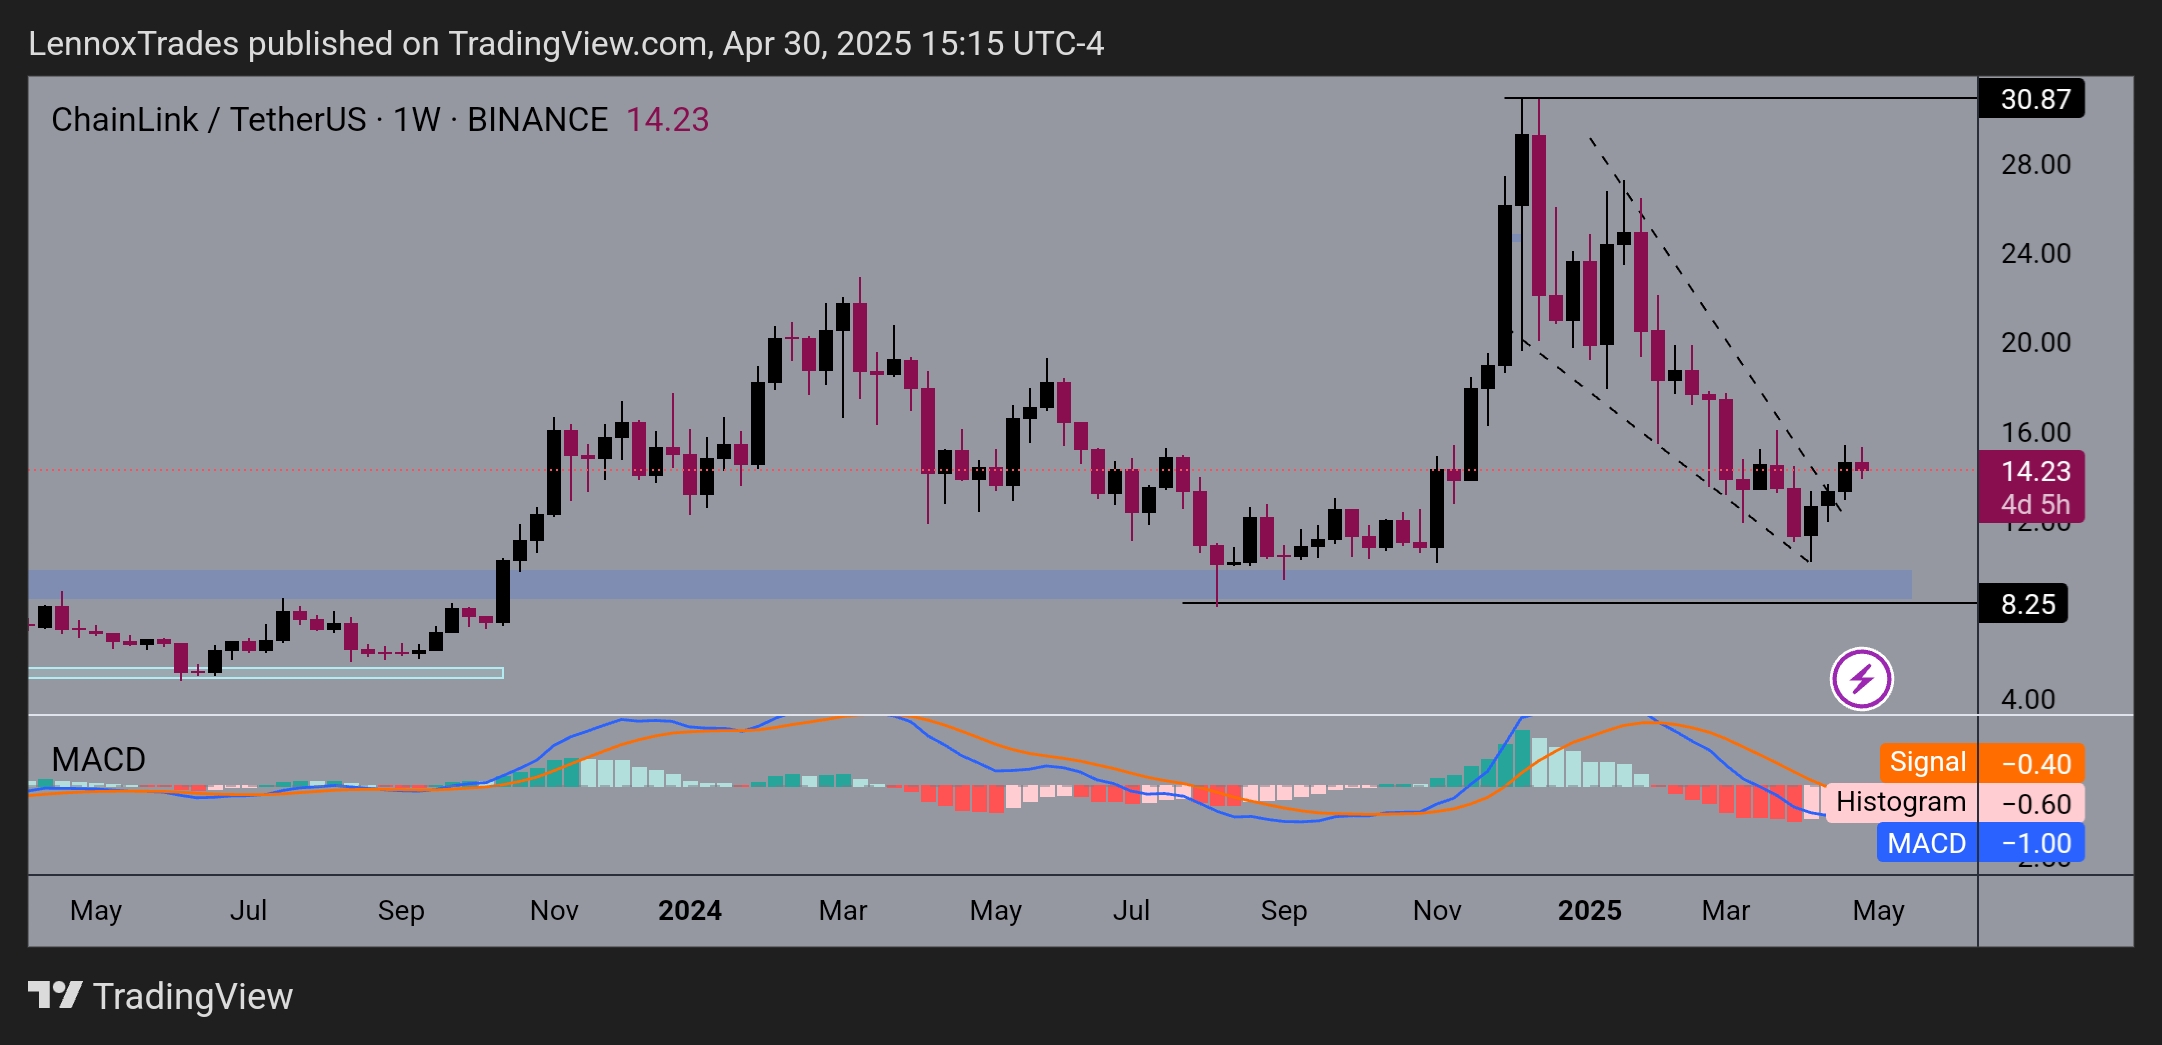
Even with the mentioned values, the evidence for gaining momentum was still lacking. Stabilization of price throughout the network within $16-$17 could help to ascertain continuation of the uptrend.
A price increase to $24.00 may result from Chainlink breaking and retesting the $20.00 level above it.
The price action at $13 could deter bearish momentum while the $10 area was a possible bearish target.
This way, Chainlink could potentially fall steeply to test previously significant support at $8.25 before entering the region where many buyers accumulated in 2023.
Analyzing the MACD alongside volume could enable traders to identify the beginning of bullishness or bearishness.
LINK’s Participants Sentiment
LINK saw bearishness in the view of retail traders and smart money institutions alike according to the market sentiment indicator analysis.
The Crowd Sentiment scored -1.82 pointing towards strong bearish bias among retail traders.
The Smart Money Sentiment was -0.76 indicating institutional players had mild bearish sentiment.
The market reflected a conservative attitude through the joint perspective of crowd sentiment, which exceeded the level of informed financial capital.
The difference between retailer and institutional investor attitudes suggested LINK could be entering a pullback or consolidation period.
A price increase could occur if the retail bearishness did not diminish once the Smart Money come in. LINK was likely to keep falling or go through the distribution phase if both indicators did not change or deteriorate.
The market could make a price movement if smart money sentiment increased above its present bearish position among retail traders.
Both the long-term bearish trend of crowd indicators and smart money indicators would force LINK prices toward lower levels.
Traders should pay attention to consistency of sentiment changes as this could help them forecast future market directions.
Chainlink Top Traders Long/Short Ratio
Lastly, in the last four days, Binance Top Trader Long/Short Ratio indicated a significant movement to increased long position holdings for LINK.
The long position percentage on Binance reached 64.85% on April 27 after starting at 56.92% on April 23.
Market leaders on Binance platform continued to buy LINK tokens silently during this period of downtrend.
More top traders held long positions as they believed LINK prices could see a sustained upward drift. Such an investment stance carried both positive and negative aspects.
The market appeared confident through rising long positions as spot trading gains strengthened their leadership role.
The rise in long positions against a declining price presented scenarios for a future long squeeze if the support breaks.
Rising long ratio indications needed to be assessed regarding market pressure and price structure to determine their fundamental tendencies.
Although price breakouts could occur in the accumulation phase, abrupt price changes were still possible.


 price prediction analysis showed it exceed its descending wedge structure. Chainlink price prediction)