

Key Insights:
- The Fetch.ai price has completed a typical falling wedge pattern breakout as it maintained support between $0.70 and $0.74.
- FET is aiming to test the $0.813 resistance zone after recovering from the $0.747–$0.759 area.
- A potential price extension to between 0.90 and 1.00 dollars follows if traders break through the $0.813 resistance zone.
FET has established its breakout through a falling wedge pattern in early May 2025. Its price reached $0.759 indicating possible bullish momentum.
FET experienced steady market consolidation between $0.70 and $0.74, which turned out to be a robust demand region.
FET is currently challenging its previous resistance at $0.76 which had proven ineffective earlier. Bulls look to continue pushing the price higher which points toward $0.813 as the next strong resistance point.
This represents a 14.83% increase from the current breakout point. A clean price surge to this range would extend the April uptrend.
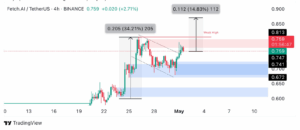
Looking at 4-hour charts, we see that the Fetch.ai price generated a textbook falling wedge pattern. The token achieved a 34.21% gain that increased its value by 20.5 cents from its April 24 low point while it later moved back to establish an upper trend for descending consolidation.
After the correction the price action created the descending resistance which formed the wedge pattern.
FET crossed wedge resistance during its movement to $0.74 which resulted in price returning to the $0.747–$0.759 area.
The token maintains its position at the top of the light red supply zone ranging from $0.76 to $0.813 during the latest market update.
Previous price rejection levels form the supply require clean price entry to achieve more upward movement.
Demand Zone Validation at $0.70–$0.74
The intense market response to the $0.70–$0.74 price zone remains fundamental to this price surge. This support area maintains its strength because it appears twice on 4-hour charts despite the bearish pressure in late April.
This price band resisted repeated testing possibly due to intense accumulation conducted by institutional and algorithmic buyers in the market.
Price launched its current impulse wave from bases established at $0.741 and $0.747 within this band.
The purchasing power grew strong that it immediately recovered previous zones before continuing to assault the $0.76 resistance.
The one-hour time frame validates the broad bullish market pattern. FET presents ascending continuation patterns as its price has broken through boundaries which were either flat or descending slightly. Since mid-April the bullish trends have appeared continuously after these chart-based formations.
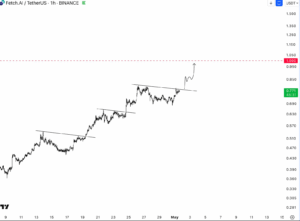
An ascending triangle pattern has developed near the $0.77 price area in the current market and price seems ready to break above this level.
The price crossing above the established resistance level will trigger an upward movement towards $0.90-$1.00 based on recent price extended movements.
Fetch.ai Price Showing Fluctuations
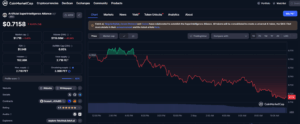
According to CoinMarketCap data FET trades at $0.7158 with a daily change of -6.45% as the market experiences brief fluctuations.
The position of FET relative to its market capitalization stands at 6.95% revealing sufficient trading activity that would help maintain upward momentum if investors return to buying.
CoinMarketCap shows a price drop while actual prices on Binance reached $0.77.
The immediate resistance point exists at $0.813 and this same level served as a swing high during April 26th.
The price measurement from the breakout using the wedge height as an addition to the breakout point matches the current levels.
Crossing $0.813 could enable FET to reach $0.90 while putting the $1.00 psychological threshold within reach.
A 20–30% upward move in prices could happen based on historical patterns after the prices break through this resistance zone.


