Can Litecoin Price Break Its Resistance at $135 and Ignite a Bull Market Rally?

Key Insights:
- Litecoin is down 36% YTD, facing key technical resistance at $135 and $160–$190.
- Whale transactions and long-term holding metrics suggest increasing accumulation.
- A break below $80 could deepen losses, but ETF speculation fuels rebound hopes.
Litecoin price has remained under pressure, struggling to recover from its year-to-date decline. The cryptocurrency is down 36% from its yearly peak, with strong resistance levels forming at $135 and a broader sell wall between $160 and $190. Despite this, on-chain data indicates growing accumulation by whales and long-term holders. This suggests a potential rebound, especially if Litecoin manages to break through these critical barriers.
Litecoin Price Faces Key Resistance Levels
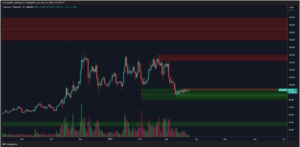
Litecoin price action has shown significant weakness, failing to reclaim its March 2024 highs. It recently crashed below the critical support level of $112.50, signaling further downside risks. The $135 level now stands as the primary resistance that Litecoin must overcome before any meaningful recovery can occur.
According to Crypto analyst CW, beyond $135, another major hurdle exists between $160 and $190. These levels mark the final barriers before a potential bull market rally. Analyst CW notes that a successful breakout above these zones could lead to an extended upside push. However, if Litecoin price fails to surpass these levels, a rejection could send it into a prolonged bearish phase.

On-Chain Metrics Reveal Whale Accumulation
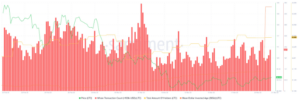
Despite Litecoin price struggles, on-chain data highlights growing accumulation among major holders. Whale transactions have increased in recent days, with large investors showing renewed interest in the asset. The number of whale transactions rose from 167 earlier in the week to 227, suggesting that sophisticated investors are positioning themselves for a potential price rebound.
Additionally, Litecoin’s 365-day mean dollar invested age (MDIA) has climbed to 600, up from 500 earlier this year. This metric tracks how long coins remain in their addresses, and an increase often signals long-term accumulation. The steady number of 8.6 million total holders further supports this trend, indicating confidence among investors despite the price correction.

Litecoin Price Technical Indicators Suggest Bearish Pressure
Litecoin’s technical chart presents conflicting signals. The asset has formed a rising wedge pattern, typically considered a bearish formation. Furthermore, a bearish flag has emerged, suggesting continued downside pressure. The recent death cross, where the 50-day moving average crossed below the 100-day moving average, further strengthens the bearish outlook.
If the Litecoin price breaks the resistance level of 135$, the next support level for LTC is 80$. This level serves as a fundamental support for the year 2025 analysis and may work as a testing zone for bulls. If the price falls below $80, then deeper declines may take the price as low as $64.
ETF Speculation Fuels Market Optimism
Nonetheless, based on bearish technical formation, Litecoin price continues to be on the lookout for future bull run triggers. Another reason investors may flock to LTC could be due to the approval of a Litecoin spot ETF. Grayscale and Bitwise are among the asset managers who have shown interest in the new products, which could see large institutional investment inflows.
Another of the major factors that gives a positive outlook on Litecoin is that it is believed to be undervalued. The MVRV Z-score is already at its lowest in months, which means that the asset is currently undervalued. In the past, such situations have provided the basis for robust bull runs in Litecoin price.


