

Highlights:
- Pi Coin price could soar by 30% if it closes a daily candle above the $0.61 level.
- The four-hour chart reveals that Pi Coin has formed a descending triangle pattern and is on the verge of a breakout.
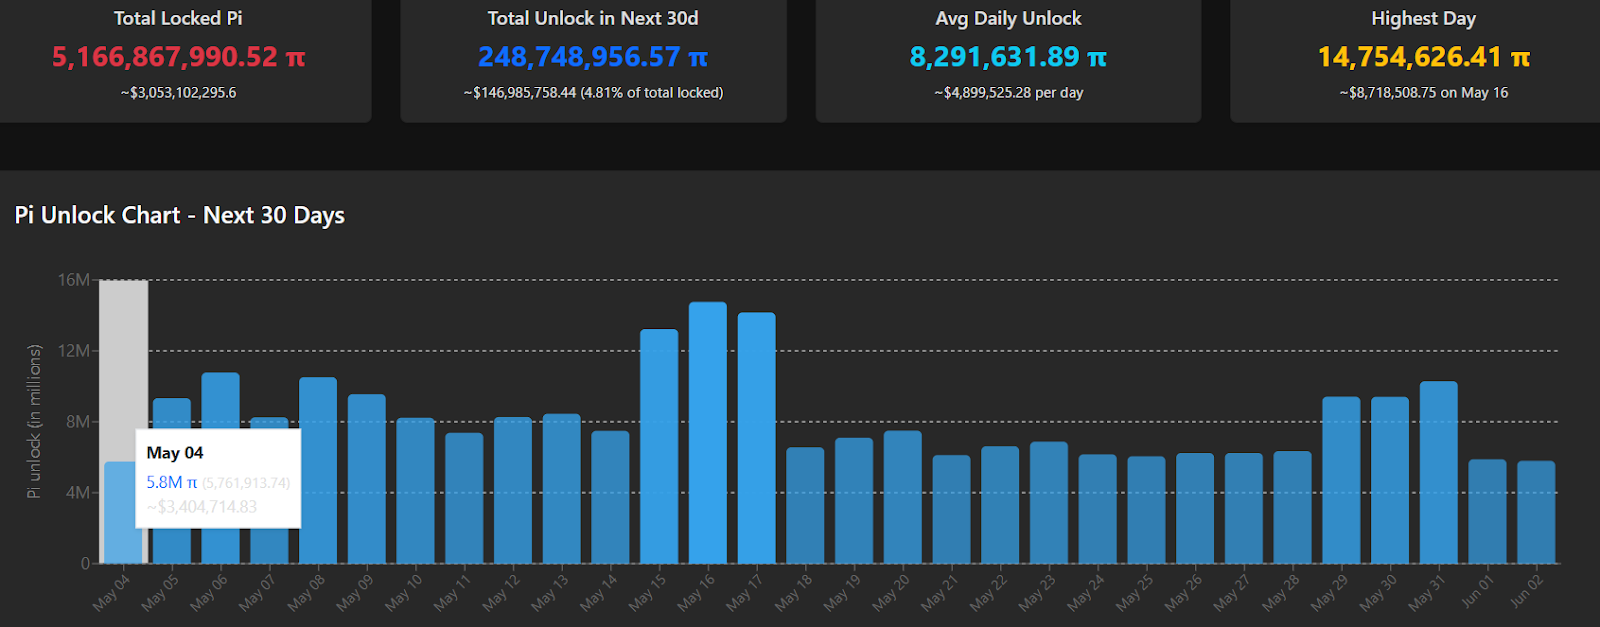
- According to Piscan, the Pi Network has unlocked a significant 5.761 million Pi Coins worth $11.523 Million in the past 24 hours.
Amid market uncertainty, Pi Coin’s price appears to be hit hard, having recorded a significant decline of over 27%.
Despite this drop, the asset has formed a potential bullish price pattern and is on the verge of a breakout.
Current Price Momentum
At press time, Pi was trading near $0.593 and had recorded a modest price surge of 1.50% in the past 24 hours.
During the same period, participation from traders and investors in Pi Coin skyrocketed, resulting in a notable increase in trading volume.
Data from CoinMarketCap reveals that Pi Coin registered a 55% surge in trading volume.
This surge in volume, along with the rise in Pi Coin’s price, reflects growing confidence among investors and traders in the asset amid the bearish market sentiment.
Pi Coin’s Upcoming Token Unlock
However, this surge in the asset’s price has also occurred during a period when the Pi Network has been consistently unlocking millions of Pi tokens.
According to Piscan, the Pi Network has unlocked a total of 5.166 billion Pi tokens to date, worth more than $3.063 Billion. The data further reveals that the network is set to unlock an average of 8.291 million Pi tokens daily.
The highest token unlock is scheduled for May 16, 2025, when the Pi Network will release 14.754 million Pi tokens worth $8.742 Million.
Given the continuous token unlocks, it appears challenging for Pi Coin’s price to gain upside momentum. However, if the bullish momentum continues despite the unlocks and Pi Coin breaks out of the bullish pattern, there is a strong possibility of a significant price surge.
Pi Coin (PI) Price Action & Technical Analysis
According to expert technical analysis, Pi Coin appears to have formed a descending triangle pattern on the four-hour timeframe, and the price has moved into the narrow zone of the pattern, signaling a potential breakout.
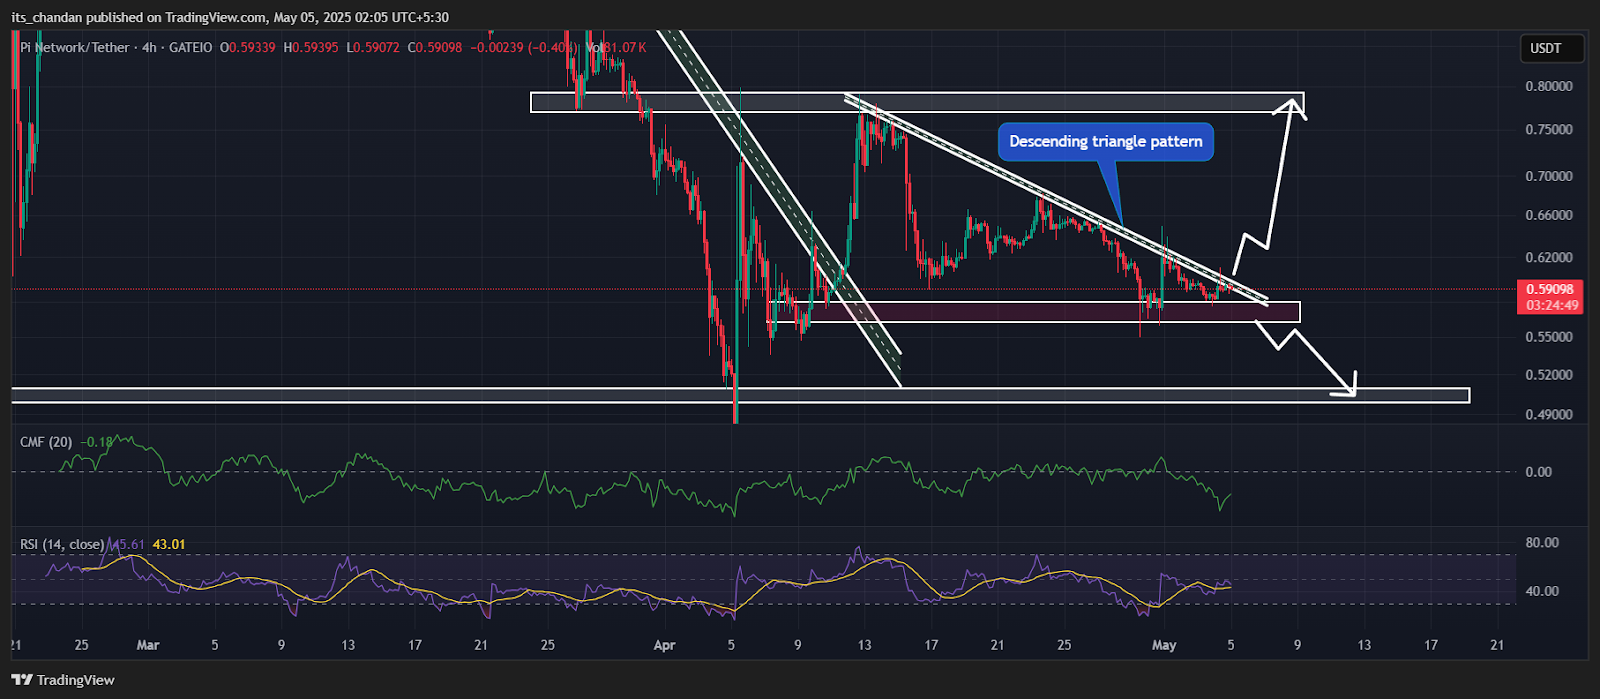
Based on recent price action and historical patterns, if Pi Coin successfully closes a four-hour candle above the $0.60 level, it could pave the way for a massive upside rally. According to the chart, Pi Coin could see a price surge of over 30% until it reaches the $0.79 level.
This bullish price prediction for Pi Coin could fail and turn bearish if the asset falls below $0.56 and closes a four-hour candle beneath that level. If this happens, there is a strong possibility that Pi Coin’s price could decline by 10%, potentially reaching the $0.50 level in the coming days.
As the price action is yet to confirm Pi Coin’s upcoming move, the Chaikin Money Flow (CMF) indicator is in negative territory, currently at -0.18, signaling strong selling pressure from traders.
Meanwhile, another technical indicator, the Relative Strength Index (RSI) on the four-hour timeframe, shows that the asset has weak strength and is currently in neutral territory, standing at 48.
According to historical data, market sentiment and traders’ views will determine whether the asset needs a price reversal or faces a price crash.


