ALGO Price Prediction: Could Algorand Hit The $1 Mark Ahead?

Key Insights:
- ALGO defends $0.20 as key technical support holds firm.
- A downward channel persists despite weekly bounce and volume divergence.
- The $1 target remains distant without breakout and volume confirmation.
Algorand (ALGO), the cryptocurrency for the layer-1 proof-of-stake blockchain, is priced at $0.2063. It experienced a 3.48% decline over the past 24 hours, sparking discussions around ALGO price prediction trends.
With a $1.75 Billion market cap, the asset is now ranked 52 by global market capitalization. The token’s $68 Million 24-hour trading volume is down approximately 3.80% since yesterday.
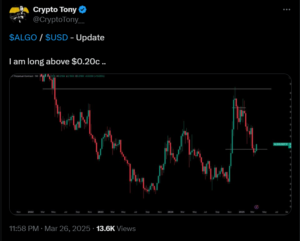
According to market analysts, Algorand could go long above $0.20. They simply believe that the $0.20 threshold is an important support line from a technical trading perspective.

However, the 24-hour price chart provided by CoinMarketCap depicts a bearish trading day for ALGO. The asset began the session at $0.2138 and was under pressure throughout the day.
Minor recovery attempts were seen in the middle of the day and during the early evening hours. However, the ALGO price prediction suggests that the token could not restore or sustain the $0.214 resistance area.
Ultimately, the price got increasingly sold off in steep selling, landing around $0.206. The weak demand signal during the decrease in market volume price is another example of weak demand and a bearish signal.
The Volume-to-market cap ratio is 3.83, an expected value indicating relatively lower liquidity and momentum.
Such a volume profile without major catalysts suggests that it will not be easy to support a bullish reversal soon. In line with the analysts, bringing it below the anchor point would not prevent further decline.
Daily Chart Reveals Descending Channel: What Does the ALGO Price Prediction Say?
A descending channel on the daily chart has defined price action from early 2025 until now. ALGO rose from $0.6 to a peak before forming lower highs and lower lows in a parallel downward trending channel.
This structured descent aligns with ALGO price prediction. It suggests the market will follow technical boundaries over external factors. At the moment, ALGO is currently at the upper resistance boundary position, near $0.21 in this channel.
However, it stayed in bearish territory and, thus far, breaking above the channel did not indicate that bulls are in control. In other words, as shown on the Volume Oscillator, the negative divergence is -20.70%.
This highlights that the volume has not kept up with the price movement. In such a negative divergence, the trend often continues and does not reverse, indicating continued selling pressure.
In the mid-term, if ALGO fails to break outside the channel, it may struggle to show significant movement. A major trend change seems unlikely without a higher volume to confirm the breakout.
ALGO needs to break this technical formation before any forecast can reach such a price of $1.
Weekly Chart Highlights Key Support and Bounce Zone
The weekly chart also displays a more positive development from a long-term perspective. The token has risen from a high above $2 in late 2021 and early 2022.
This came after an extended decline starting in late 2021, bringing ALGO to a low near $0.10. The cryptocurrency then began a recovery phase throughout 2023 and 2024.
At one rally, this reached $0.60. However, ALGO has undergone a sharp correction and returned to the critical $0.20 range. This level has recently acted as a vital support area for cryptocurrency.
Conversely, this $0.20 level could be in play as support since it aligns with a former horizontal resistance level. The weekly candle draws a 13.05 % increase to end at $0.2166. This indicated that buyers are trying to defend this level.
The bounce aligns with the analyst’s perspective of ‘going long’ above $0.20. It reinforces the view that this level is a pivot of control on higher time frames.
The weekly structure indicates significant challenges for an upward trajectory. Considerable effort is needed to surpass resistance zones between $0.25 and $0.35.
As per ALGO price prediction, these zones have shown consolidation and distribution in the past. Creating a successful breakout from this zone will be a prerequisite to attaining higher levels of $0.50 and even $1.
It has a 10 billion ALGO maximum supply and 8.53 billion in circulation. This means only 85% of the supply is active, reducing future dilution risks.
However, if released, the 1.47 billion tokens have the potential to give the market force more than proportional demand growth. The FDV to market cap ratio of 1.18 indicates that the fully diluted valuation is higher.
However, it’s not out of line with the current valuation. This suggested that long-term tokenomics are not overly diluted.
This small gap indicates that most of the upside is driven by organic demand growth, adoption, or speculation interest. It highlights that supply-side reduction plays a lesser role in influencing the increase.
Will ALGO Reach $1?
From a mechanical perspective, ALGO remains in a recovery phase. Multiple support levels must be cleared before higher levels become achievable.
To progress, the first hurdle is breaking above the current descending channel. Regaining mid-term resistance levels in the $0.25 to $0.30 range will be crucial for upward movement.
Assuming the current price of $0.2063, reaching $1 would require approximately a 385% increase. However, such a feat relies heavily on market momentum, high-volume participation, and related ecosystem developments.
The technical merit lies in the analyst’s strong confidence in the $0.20 support. Meanwhile, the charts have not established a strong reversal to aim for the $1 mark.
ALGO price prediction highlights its consolidation near a key level, dependent on signals of a breakout or breakdown. The road to $1 remains unproven until the asset exits the downward trend with confirmed momentum and volume support.


