

Highlights:
- ICP has been moving downward inside a descending channel, with significant resistance at $5.53 and support located at $5.09.
- If the price rises above $5.53, that could mean an upward touch on the charts, but failure could bring the price down to $5.09 or even lower.
- The growth in the stablecoin market cap and the steady protocol activity reveal that the network remains active, even with weak prices.
The ICP token has been contained within a falling channel as seen on the 5-minute chart. At present, the token’s price rests near significant support or resistance which may result in an upward or downward move. It will use technical chart patterns, current market statistics and activity of the protocol to assess how ICP may behave in the next few days.
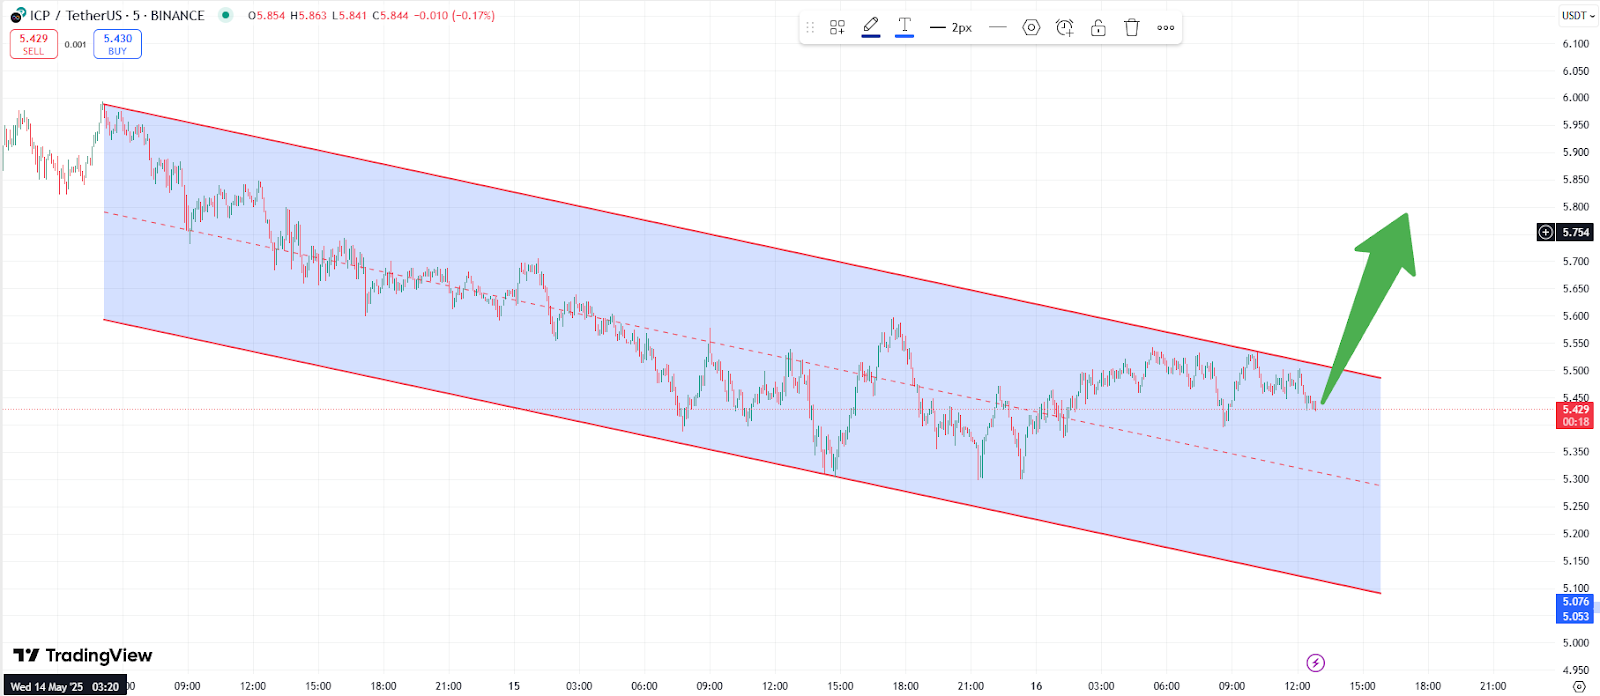
On the 5-minute chart on Binance, ICP price action has remained trapped in a downward channel that has parallel trendlines. The market has been moving down in a channel that started about two days back, and it has stayed between around $5.09 on the way up and around $5.53 on the way down. It is currently trading at $5.43, trying to stay on track within its channel.
It is easy to notice the decline with the lower prices that each new high and low brings. Staying above $5.53 will be very positive for the price.
Should prices break out above this resistance level, it could mark the start of a short-term rebound that moves the market towards a positive outlook. If the $5.53 resistance is not broken, the price could move downward towards the lower boundary at $5.09.
This is supported by the dashed line running through the channel, near $5.30-$5.40, which suggests the price has tested this equilibrium a number of times as it consolidates.
Broader Market Price Trends and Historical Context
Daily data from CoinMarketCap shows ICP prices have been falling steadily for the past year, and the token is currently valued at around $5.22, having decreased 4.73% in the past 24 hours.
Circulating tokens amount to 533.45 million ICP, giving the company a market capitalization of $2.78 billion, which is almost identical to its fully diluted valuation (FDV).
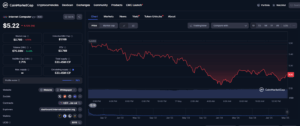
Historical charts indicate that ICP reached its peak in late 2021 and early 2024, but from then on, its value has mostly fallen. It is in line with the chart in the tweet, which suggests that before the prolonged fall, two big peaks in price were experienced.
The resistance at $20-$30 was broken, but ICP was unable to hold those levels, confirming a longer period of bearishness.
DeFi Activity and Protocol Metrics
The data provided by DeFiLlama on ICP helps explain how changes in token prices relate to activity on different protocols. According to the latest information, the TVL of ICP is about $28.66 million, which is a minor decrease from yesterday’s value. Trading volume on decentralized exchanges was $987,515 yesterday, reflecting average activity based on the market cap.
The protocol fee points to $3,682 earned within 24 hours, which suggests the network is being used continuously, even if not at peak levels. The stablecoin market cap in the ICP ecosystem has gone up by 14.15% in one week, suggesting that stablecoin activity remains resilient even as the market struggles.
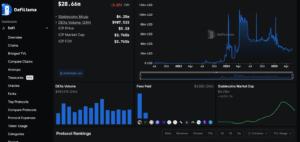
Collectively, they suggest that ICP tokens are being used regularly but with less activity in decentralized finance. It is possible that stablecoins will moderate downward price movements.
Key Price Levels and Potential Outcomes
$5.53 is the key technical point at which the market can shift direction. Should prices cross this point to the upside, it could mean the descending short-term channel is finished, and prices could approach the next resistance levels. With a reversal happening, traders betting on a trendy rally could push the price of ICP higher, possibly crossing $5.75 in the short term.
If the price doesn’t rise above $5.53, it could cause the token to review the channel’s support line around $5.09. If this support is breached, the selling pressure could speed up and may bring the price back to the key support seen earlier around $5.00.
Based on the trend in the 5-minute chart, traders should pay particular attention to indicators related to trading volume and price around these borders. A significant increase in volume after the price breaks through $5.53 would prove that bullish energy was present. Conversely, if trading volume is low, the chances of a false breakout and a reverse correction become higher.


