

Highlights:
- JasmyCoin rallied 385% following a breakout from a multi-year resistance level, closely followed by gains exceeding 560% from the cryptocurrency’s price bottom.
- Bullish technical signs from MACD and CMF point to continued price gains, with a possible target of $0.2785.
- The increase started after JasmyCoin formed a descending wedge, experiencing high trading activity.
JasmyCoin ($JASMY) has surged significantly ever since it managed to break above a persistent resistance level. The price has increased by close to 400% since the breakout and has climbed by more than 550% from the bottom since the beginning of the rally.
It appears that the coin’s price is recovering rapidly, and there could be additional upward movement in the short term.
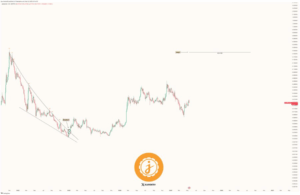
Following a phase where the token was held below a series of downward lines, it broke out. The line on the chart highlights how the token overcame obstacles to improve its direction. After the breakout, $JASMY’s price has moved higher and has remained supported by the resistance level.
The current value of the coin per CoinMarketCap is $0.01815, and its total market cap is around $898 million. Trading volume of $61.5 million in the past 24 hours indicates that the market continues to pay attention.
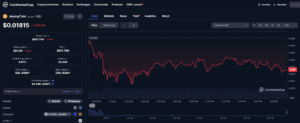
Currently, there are about 49.44 billion $JASMY tokens available, just 0.5% less than the total maximum supply of 50 billion.
Technical Indicators Support Continued Uptrend
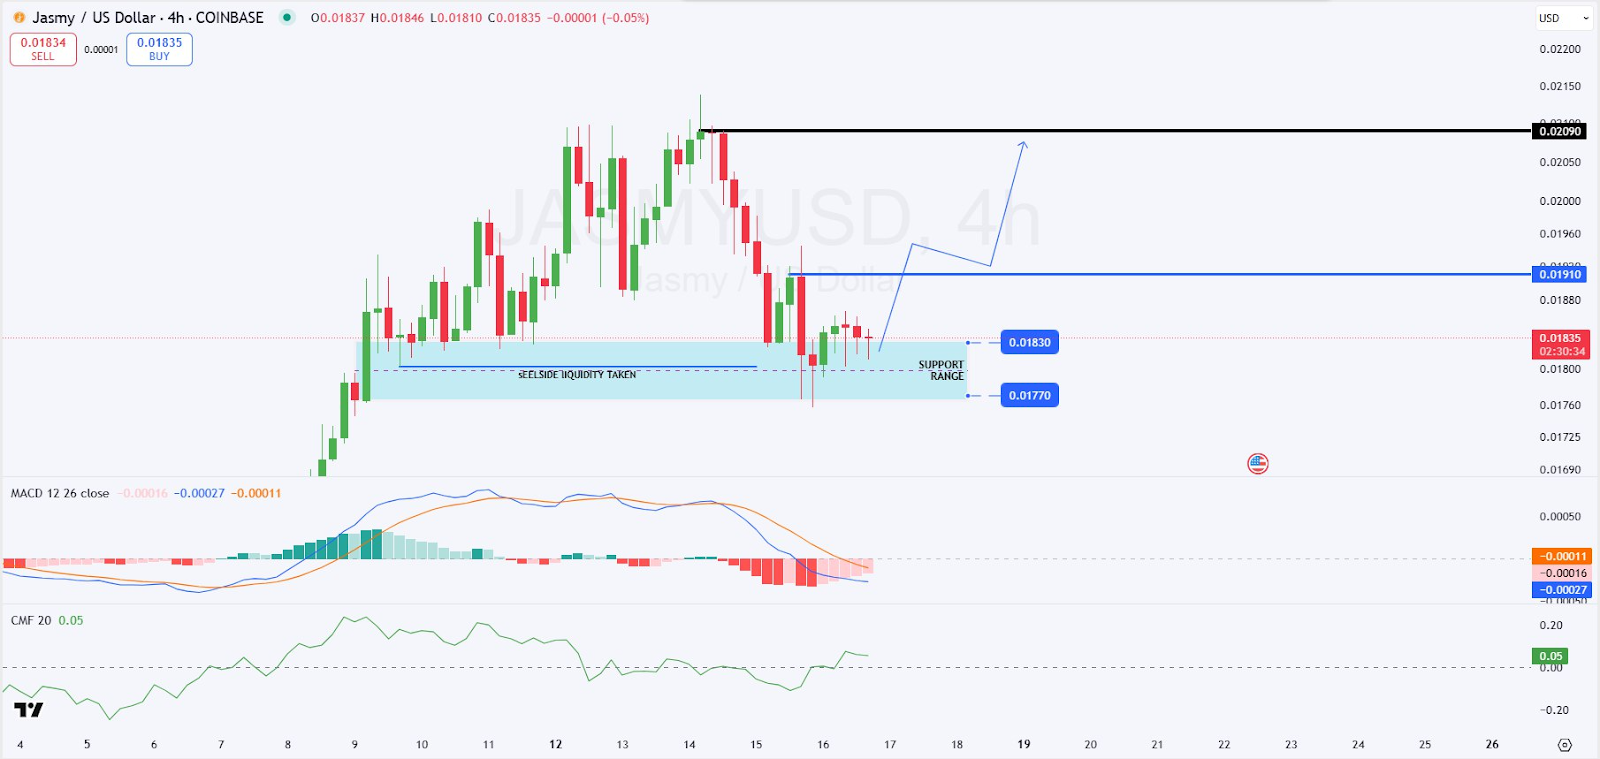
Prices have respectably held above a crucial support zone in the last 4 hours, stopping potential downward momentum. The MACD indicator may be hinting at an upcoming bullish move since the MACD line is coming closer to the signal line from below. Chaikin Money Flows (CMF) currently stands at a score of 0.05, indicating increases in interest and capital expenditure on the token.
The price is likely headed higher, approaching a first resistance at $0.0191, where the market could consolidate before potential additional gains. Elsewhere, the price could surge higher toward $0.2785, translating to a massive rise of over +1,400% from its current position.
Experts believe $JASMY could further rally by more than +1,400% if the coin continues to trade in an uptrend and breaks above $0.2785. The current prediction matches the previous trend following a breakout. During which the price has risen by over +500% since its lowest point and by nearly +400% from where the rally began.
What’s Next for JasmyCoin
Gains from the past few months indicate a significant market recovery. Breaking above resistance triggered a shift from a downtrend to an uptrend backed by significant trading volumes.
A descending wedge pattern appeared on the charts right before the price started to increase. Seeing a break above the upper trendline in a descending wedge can indicate that the market might move higher in the main direction. When there is a lot of volume at the breakout, it is usually a sign that this pattern will succeed.
Most of the current data on Jasmy’s blockchain suggests that the token is bearish, as around 57% hold the token at a loss and only 36% have made a profit from it. Confidence is high in this token as only 21% of holdings are spread among small traders, but its network activity and large transactions are both seeing declines.
Jasmy’s price move with Bitcoin suggests that its gains would likely result from factors outside the project, not on their own support.
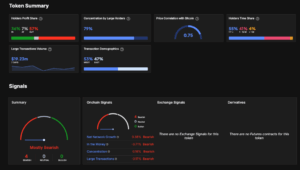
Most S&P 500 shareholders, about 55%, have held on for over a year, while 45% hold the stocks temporarily. Jasmy’s large transaction volume over the past week is just $19.23M, suggesting that institutions are not interested in it.
Since all four major chain metrics are weak and there are no offsetting signals from exchanges or derivatives, the technical situation looks cautious unless there is a sudden improvement in market sentiment.
After the breakout, price drops have been shallow and have happened close to the price support that is forming at the new highs. Prices above the breakout show strength from the bulls, who may push prices up even more.
We got this target price of $0.2785 based on the measured move of the descending wedge. It means that the actual price could be more than the price shown on the label. Here we aim to gain over +1,400%, which is very close to the suggested +1,530% increase.


