

Key Insights
- Sui price surged from $2.00 to $4.16, forming higher highs and higher lows on the weekly chart.
- Open Interest in SUI rose 31.03% to $1.74B, showing strong trader participation.
- SUI’s trading volume jumped 63.83% to $2B, with short liquidations exceeding longs by nearly $1M.
SUI price has experienced a consistent upward trend across various timeframes, signaling strong market momentum. Investors speculate whether this rally could push the token toward the $5 milestone.
The current price action, market data, and technical structure reflect growing momentum. Bullish signals appear on charts, and trading activity is increasing in spot and derivatives markets. Traders are monitoring for a possible breakout above the key resistance level.
Technical Structure Shows Upward Momentum on the SUI Price
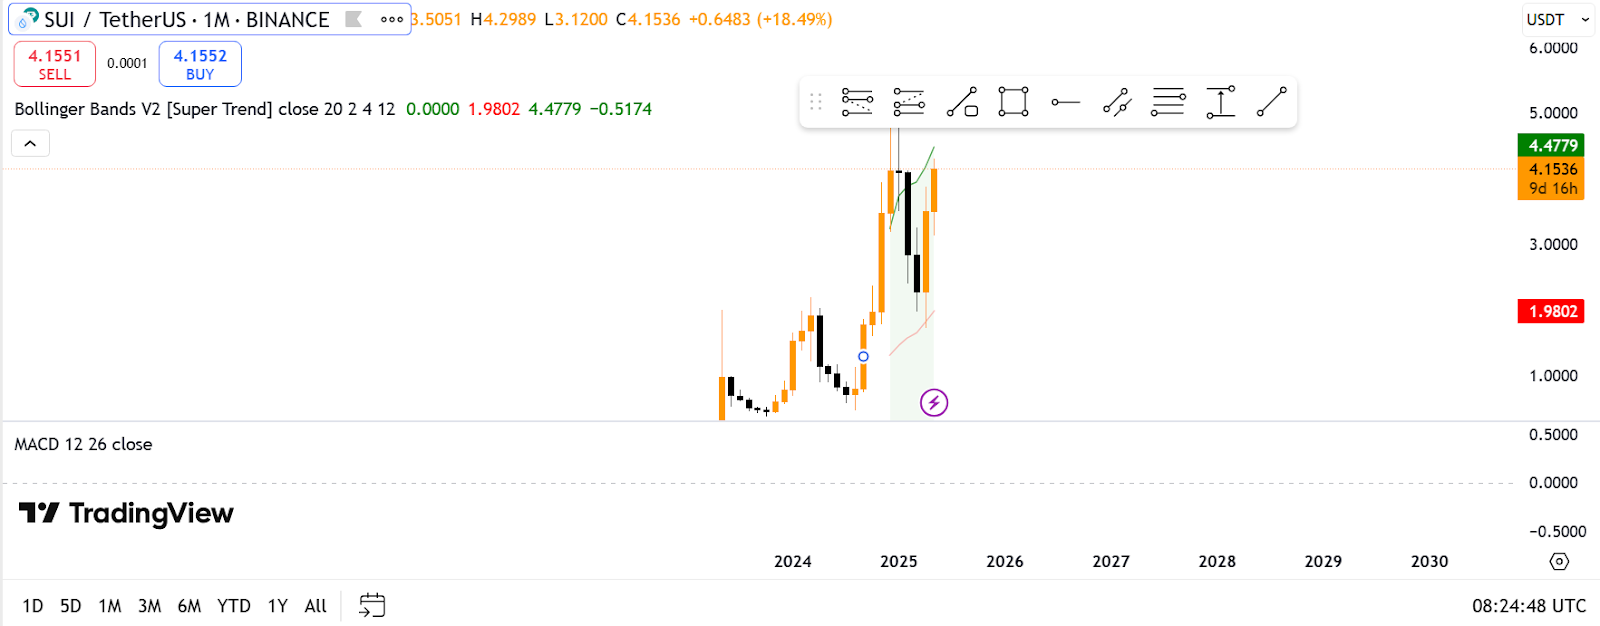
SUI/USDT has formed a bullish structure on Binance’s weekly chart. The pair has developed a pattern of higher lows and higher highs, which often suggests a market reversal. The most recent breakout came after a recovery from the $2.00 area, which now serves as a key support level.
The current weekly price stands above $3.90, with a strong move that indicates active buyer participation. Each green breakout zone on the chart marks where price action broke above prior resistance with increased volume.
These breakouts point to renewed interest and sustained SUI price movement. On the monthly chart, SUI shows a gain of over 18%, now above $4.15. The $1.98 level, from which the price bounced, is being watched as long-term support.

The upper Bollinger Band on the monthly chart stands at $4.48. If momentum continues, this level may act as the next test.
The Relative Strength Index (RSI) is above 50 on the weekly timeframe, indicating a bullish trend. Traders often use this level to confirm that the price is in an upward phase.
Derivatives Data Shows Bullish Sentiment
Sui derivatives market is seeing rising interest. Trading volume is up by 51.22%, reaching $5.38 billion. Open interest also increased by 31.03%, now at $1.74 billion. This data suggests more traders are entering or maintaining positions.
Long/short ratios are leaning bullish. On platforms like Binance and OKX, the ratios are above 1.4. Binance’s top traders show an even stronger bias with a ratio of 2.1275 in favor of long positions. This signals strong expectations for continued price gains.
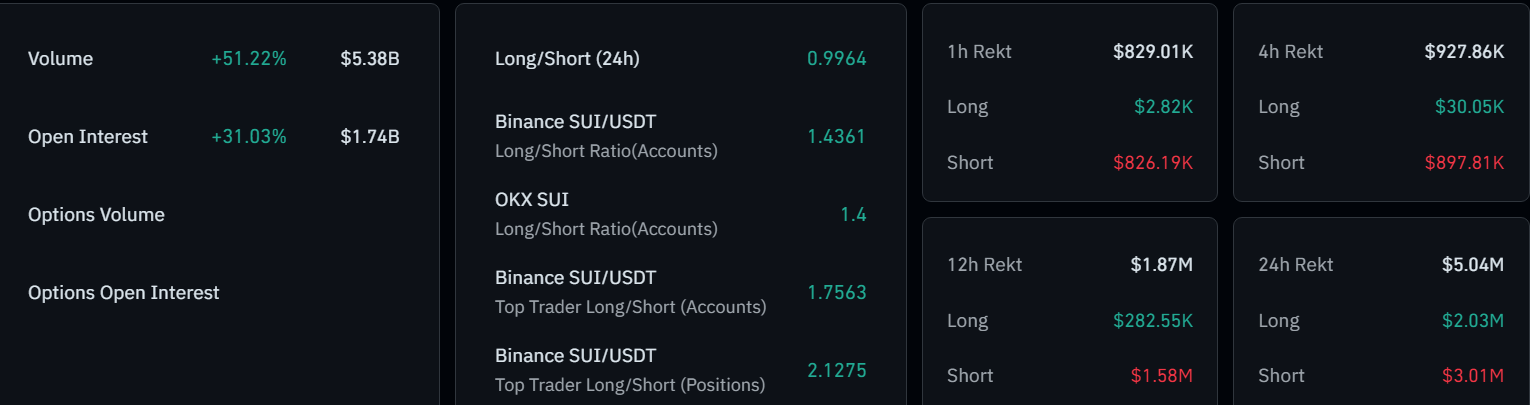
Short positions are being liquidated more than long ones. Over the last 24 hours, short liquidations totaled $3.01 million, while long liquidations were $2.03 million.
This pattern typically happens when the price moves against those expecting a decline. The current 24-hour long/short ratio is near 1.0, showing a nearly balanced market, though slightly tilted toward the long side.
Real-Time Market Activity Reflects Strength
As of the latest update from CoinMarketCap, SUI price was trading at $4.16. The price has gained 8.42% over the last 24 hours. Market cap is now at $13.9 billion, reflecting an increase of 8.35%. These movements indicate vigorous activity and growing investor interest.
Trading volume has reached $2 billion, marking a 63.83% increase within the same period. More participants are actively buying and selling.
This activity boosts market liquidity. A volume-to-market cap ratio of 14.4% is considered healthy and shows active trading relative to size.
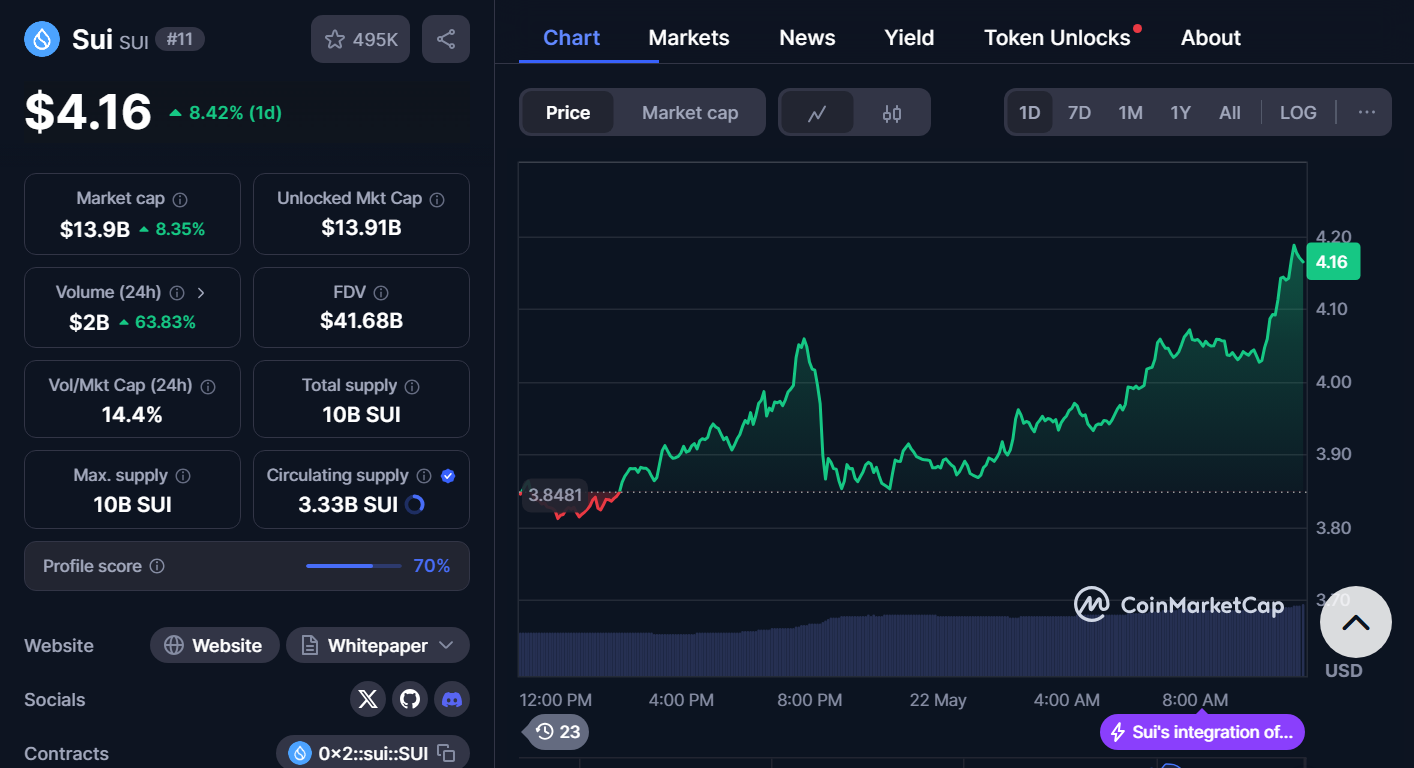
Sui has a total token supply of 10 billion, with 3.33 billion in circulation. The fully diluted valuation is $41.68 billion.
The token is now ranked #11 by market capitalization, with a growing number of watchers, currently 495,000. This indicates strong community engagement and visibility across platforms.
SUI Price Key Levels and Price Outlook
According to indicators and chart analysis, SUI price could break through the $5 mark. The $4.48 zone represents monthly resistance above the upper Bollinger Band. If the price exceeds this, the following objective might be close to $5.
Buyers are stepping in to defend the support, which remains at $1.98. Higher lows and the ability to break through new highs will support a long-term rise. The MACD has not given a convincing signal yet, but it will soon turn upwards. As a result, prices should keep improving.
Many traders will continue to observe volume and open interest in the derivatives markets. If the metrics remain high or improve, it may show that SUI’s current direction will continue.
If the cryptocurrency rises above $4.50, it could gain momentum. With strong market demand and stable conditions, it may attempt to cross $5.


