Sui Price Prediction: SUI In A Rising Wedge As Short-Term Analysis Shows Critical Support
- SUI price prediction forms a rising wedge with substantial volume and open interest.
- Fibonacci extensions align with resistance, suggesting further upside for SUI.
- Futures data shows rising participation, confirming a bullish Sui price prediction.
The Sui price prediction is in a rising wedge in the weekly time frame, which suggests that both traders and prices are increasingly active.
According to blockchain data, Sui is going through a consolidation phase in an ongoing upward channel that began in late 2023.
The presence of this pattern, plus a lot of future data, suggests that there is consistent interest from both those who trade in stocks and those who deal in retail.
Sui Price Prediction: Sui in a Rising Wedge on Long-Term Charts
On the weekly chart, a rising wedge is noticeable, formed by lines that keep moving closer to each other. Such a pattern generally signals a bearish reversal after an uptrend. Still, when supported by volume and open interest (both present now), it may reflect a time when the price consolidates before heading up.
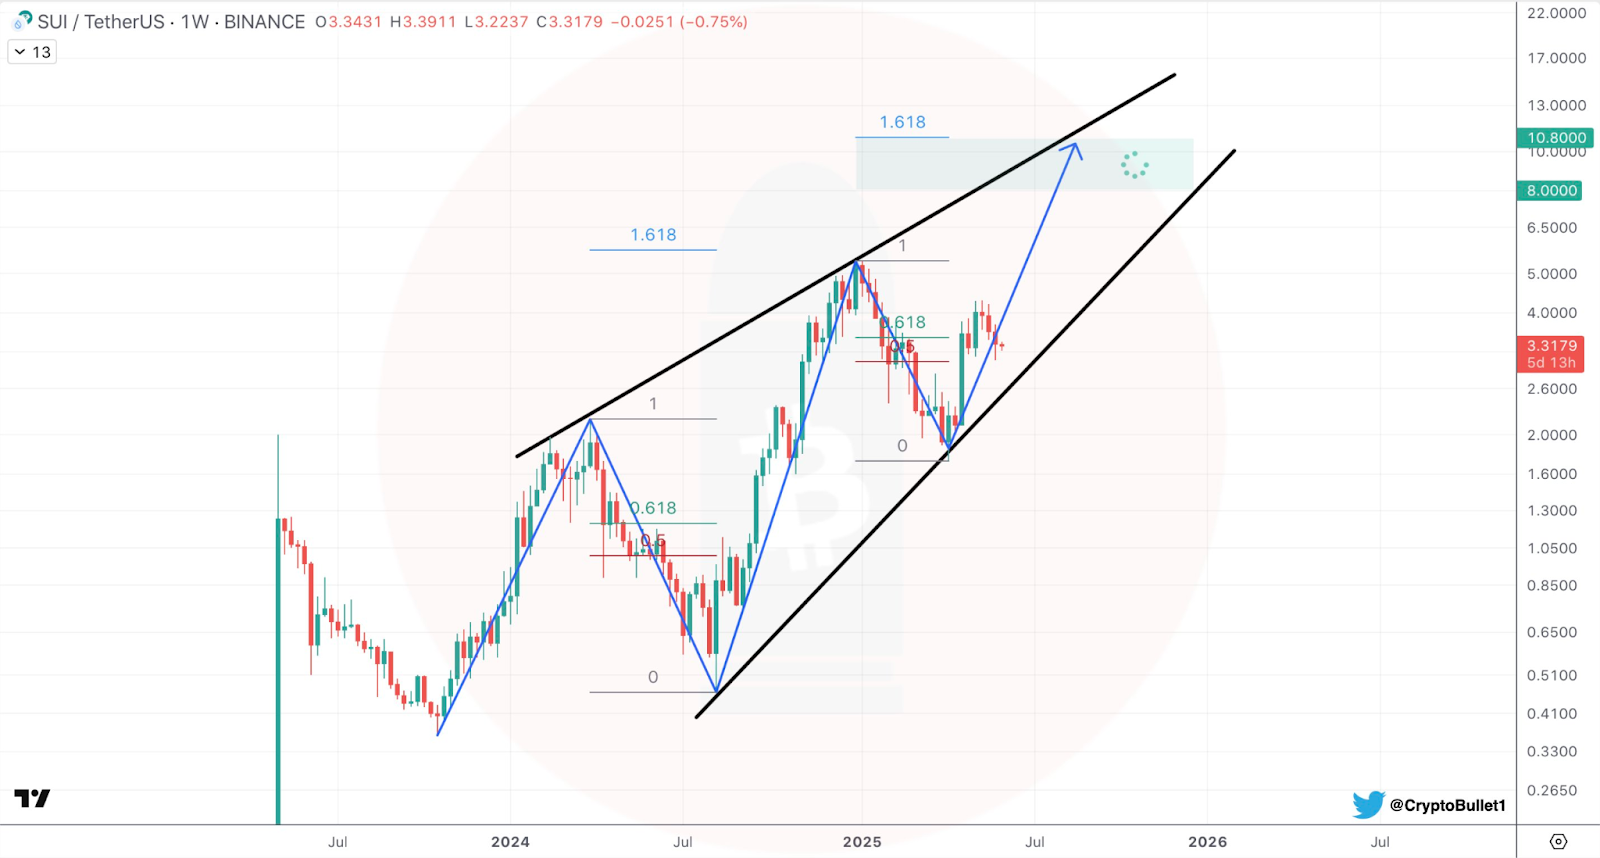
Many impulsive waves are illustrated on the chart, and all honor essential Fibonacci levels. The primary impulse wave starts as 0–1, pauses at 0.618 to correct, and then resumes its upward movement.
This happens repeatedly, confirming that the price considers Fibonacci retracements. The current surge seems to be aligned with the previous one. This possibly signals that SUI is gearing up for another move higher inside the wedge.
According to the Fibonacci 1.618 extension targets indicated in the chart, it is currently being sold at $3.31. This suggests it could go between $8.00 and $10.80.
The highlighted region lands on the top resistance line of the rising wedge, which adds weight to the target zone.
SUI Price Tests Falling Channel Resistance After Reclaiming Key Support Zone
Examining the 4-hour SUI/USDT chart closely makes it clear that things are changing in the short term. After the support zone between $3.10 and $3.20 pulled SUI higher, the cryptocurrency rose from a long-lasting falling channel.
Since late April, this zone has shown its importance as a demand spot, as stated by historical price movements and increased interest from buyers.
Because of the rebound, SUI is closer to the upper line of the descending channel, and this may result in a breakout if the current momentum is sustained.
The price moves into consolidation in low volume above the support, which is often followed by a strong directional move. The ADX is at 19.12 presently. This suggests that though the trend is weak now, a shift in momentum could be near.=
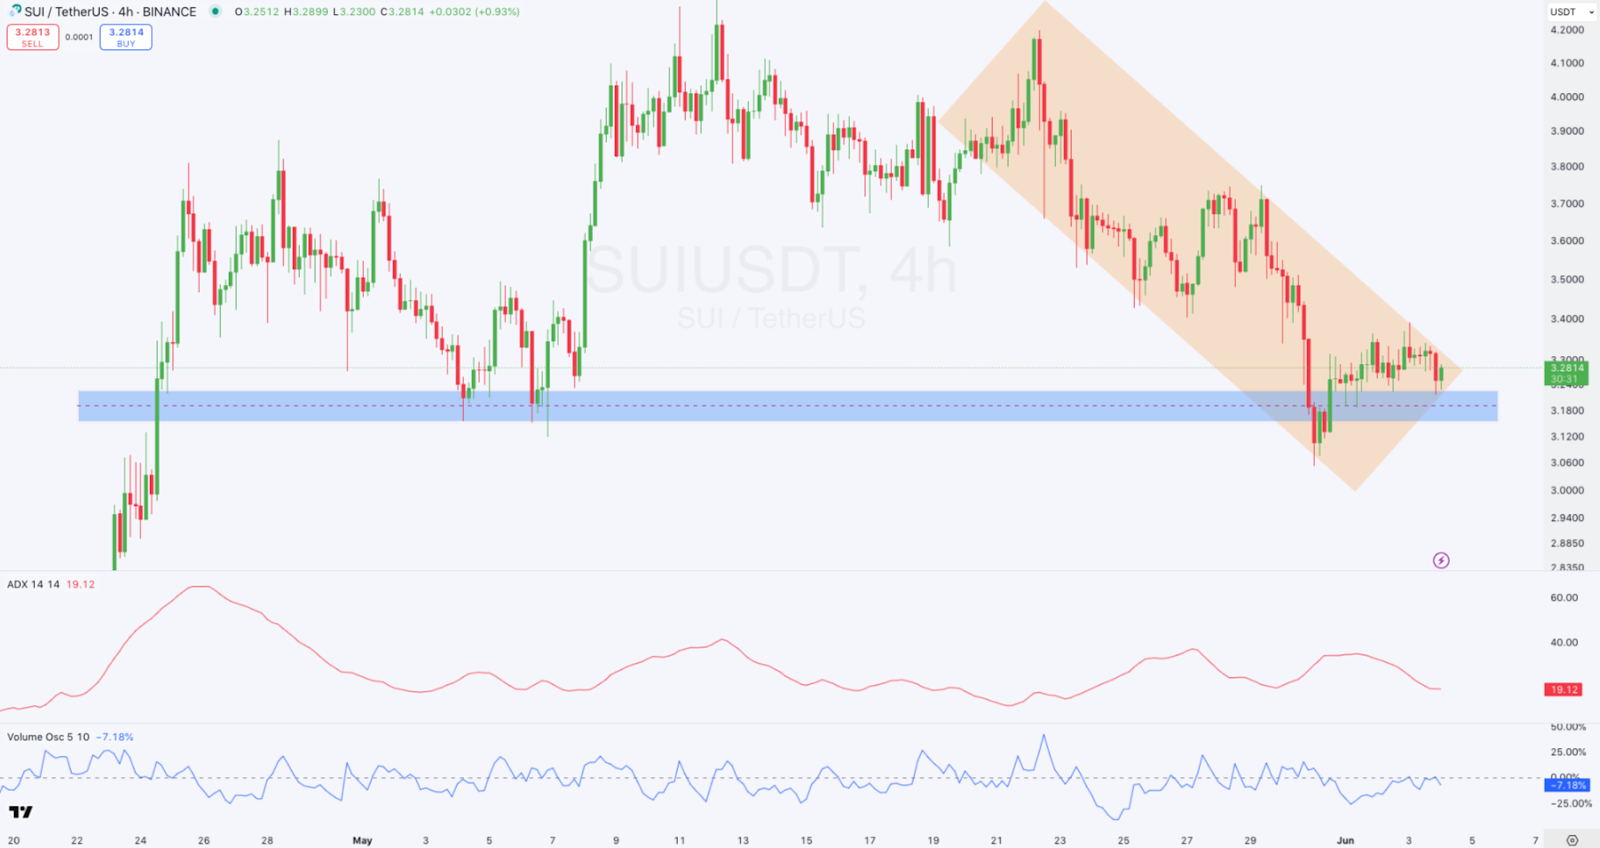
Besides, the volume oscillator is in negative territory at -7.18%, signaling that there is currently less action in the market. Such periods are often trailed by increased activity, especially after a falling wedge or channel is about to resolve.
A breakout beyond the resistance line might initiate a change in the trend. In the best case, it could also imply a move in the price range to $3.60 to $3.80.
SUI Derivatives Data Supports Uptrend
Information from CoinGlass on Sui derivatives gives further insight into the market’s workings. Based on their open interest (OI) figures, all major exchanges show high participation in SUI derivatives.
Open positions on Binance are the highest at $292.58 million. This is closely followed by Bitget ($262.70M), Gate.io ($231.85M), and Bybit ($206.88M).
The daily trading volume for SUI on MEXC is $2.17 billion. This is much higher than that of Binance ($531.30M) and Bybit ($257.95M). Since MEXC processes a lot more volume than other venues, it caters to those who need quick and frequent trades.
The number of futures trades shows that Binance and BingX topped the chart with a total of 1.57 million. After that, Bybit (330.59K) and MEXC (281.74K) round out the list. The large number of trades taking place on various platforms signals that many people are interested in SUI.
The OI-weighted funding rate chart shows some signs of uptrends and also some downtrends. While the crypto market occasionally made good gains in May, during both gains and losses, the curve has largely stayed flat.
Since futures funding rates are not highly fluctuating right now, there is no indication that the market is too heavily favoring either short or long futures.
Stable funding and increasing open interest show that new traders are cautious and likely to open positions to seek medium-term profit instead of quick market changes.