
Key Insights:
- FLOKI crypto is consolidating within a symmetrical triangle with a potential breakout target of $0.00011000.
- FLOKI crypto price has repeatedly tested support at $0.00007865, indicating strong accumulation at this level.
- A breakout above $0.00008631 may confirm bullish momentum toward higher resistance zones.
FLOKI crypto is trading within a narrowing technical range, with several analysts suggesting that the cryptocurrency is set to break out due to significant chart formations. Charts observed on daily and intraday time frames indicate a potential shift in direction, along with bullish and bearish estimates in market support.
FLOKI Crypto Approaches Breakout Signaling 30% Rally
Analyst The Crypto Titan indicated that FLOKI crypto has developed a symmetrical triangle. The triangle is identified as a converging trendline formed with the decrease in highs and increase in lows, meaning the compression of FLOKI price. Further, the asset has moved close to the apex of the triangle, which in most cases is the level where a full-blown breakout is expected.
Moreover, FLOKI crypto price has been slightly above the rising support line of the triangle. In the past, FLOKI price action has undergone several retests and tests of this support zone in the month of June, which indicated a high presence of buyers. Furthermore, an active rising bullish candlestick pattern on this trendline provided more technical support for an increase in FLOKI crypto price.
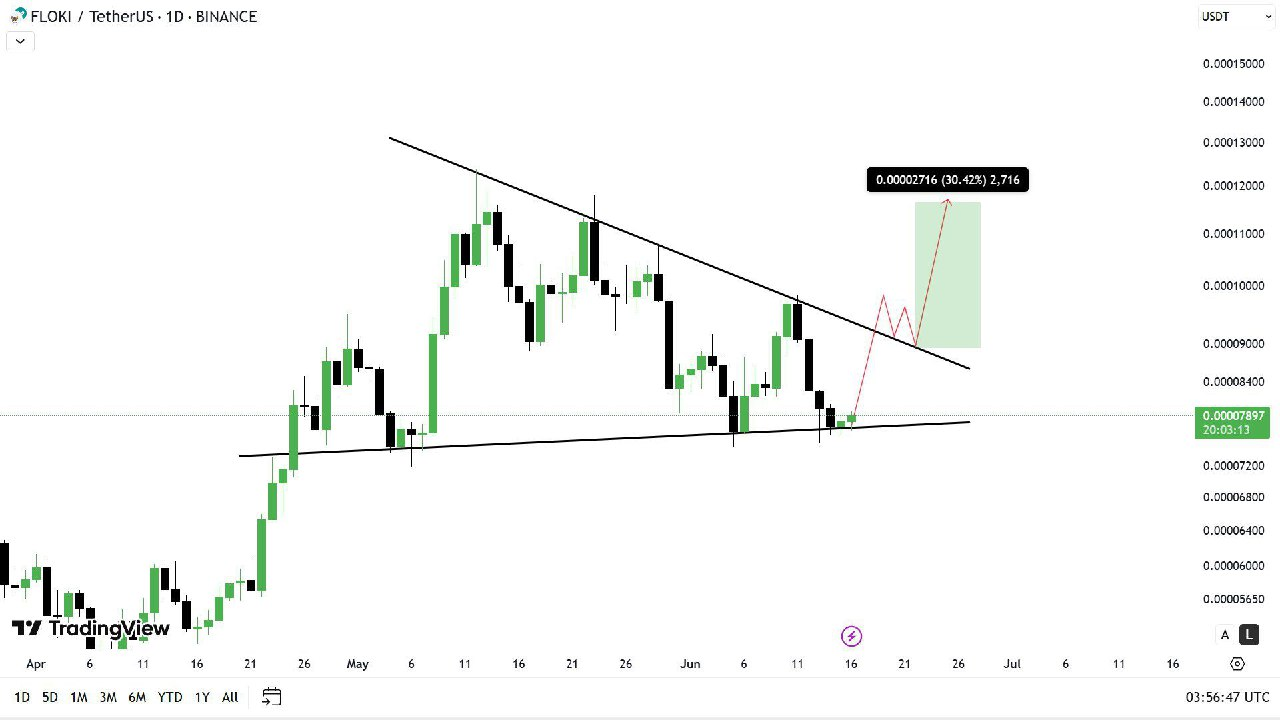
Further, the analyst has pointed out a 30.42% upside opportunity after breakout with FLOKI crypto at the value of $0.00011000. This technical move is projected to meet the past local highs, backed by the measured move in the symmetrical triangle analysis method.
In addition, the projection during the pullback and retest stage is also expected, an otherwise typical phenomenon that can occur during a breakout period, before continuation. FLOKI crypto’s current volume profile shows a gap above, which may allow for a less resistant path upward if bullish momentum gains confirmation.
Descending Triangle Point To Breakout for FLOKI Crypto
Analyst $SHIB KNIGHT pointed out a descending triangle pattern on FLOKI crypto. This is a bearish-to-neutral structure that is made up of a support level at about $0.00007865 and a decreasing resistance line that is constituted by lower highs. The regular testing in the horizontal support implies that pressure is building up in the contacting range.
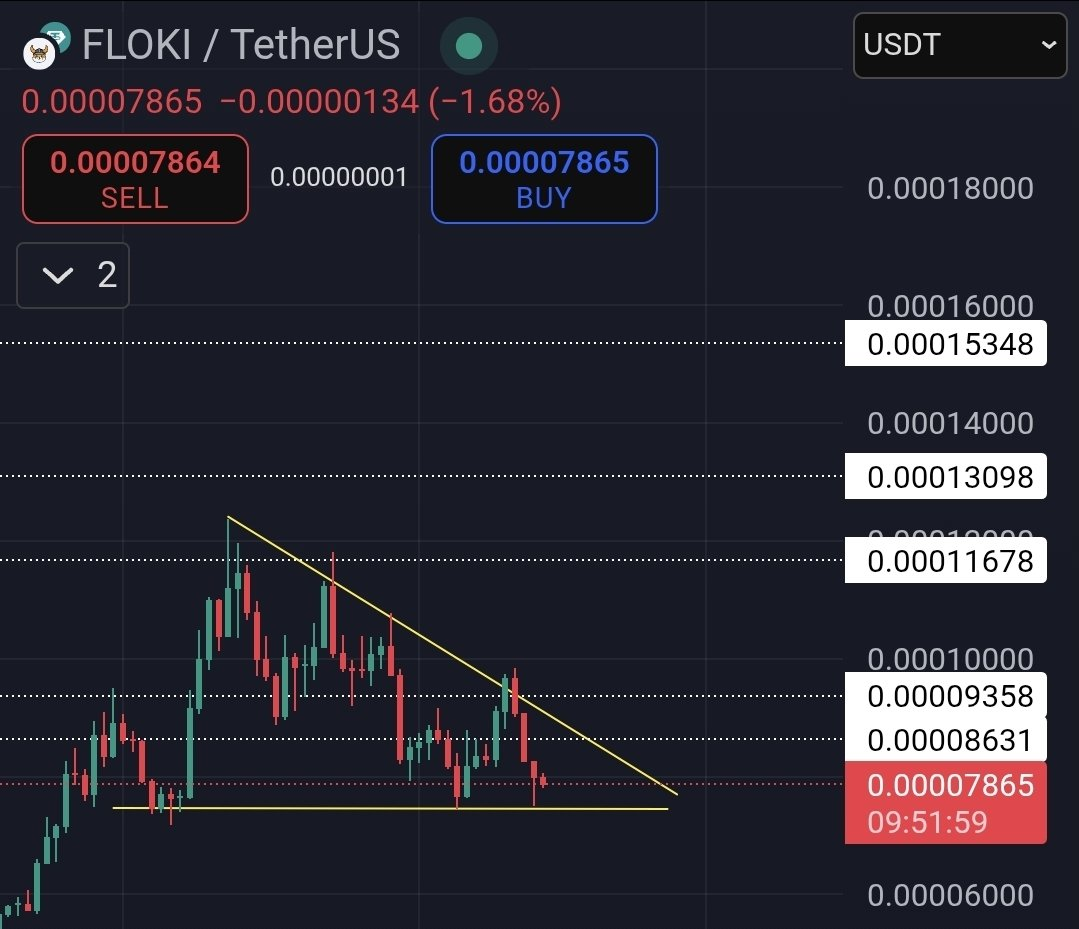
Additionally, resistance checkpoints are noted at $0.00008631, $0.00009358, $0.00011678, $0.00013098, and $0.00015348, based on historical FLOKI crypto price rejections. For FLOKI price to confirm a breakout, the resistance level must first be breached and reclaimed as support. At present, FLOKI crypto action remains coiled near the base, making this zone critical for short-term direction.
More so, the analyst noted that the tightening candle structure and declining volume are typical signs of accumulation. If a breakout is confirmed, the next upside target is set at $0.00015, representing an approximate 90% gain from current levels. However, no confirmation has been made, and volume expansion will be essential to validate this scenario for FLOKI crypto.
Sideways Action and Indicator Shifts on 4-Hour Chart
Analyst on a 4-hour chart noted that FLOKI crypto experienced a lateral movement after its downtrend in early June. The current FLOKI price is at the level of $0.000079, which indicated consolidation in a very narrow range. This has been stabilizing following an overall bearish trend that was reported in late May.
Based on the chart, it is visible that there exists an indication that accumulation is taking place despite volatility being in check. The tight price range and low volatility in FLOKI crypto suggest market indecision, likely caused by reduced trading activity.
Furthermore, the Bull and Bear Power (BBP) indicator has turned slightly positive after a long period of negativity. Such readings indicate that buying pressure is perhaps now balancing or slightly exceeding selling pressure. Although this change does not conclusively signify a shift to more neutral or bullish sentiment soon, it is a sign of that.
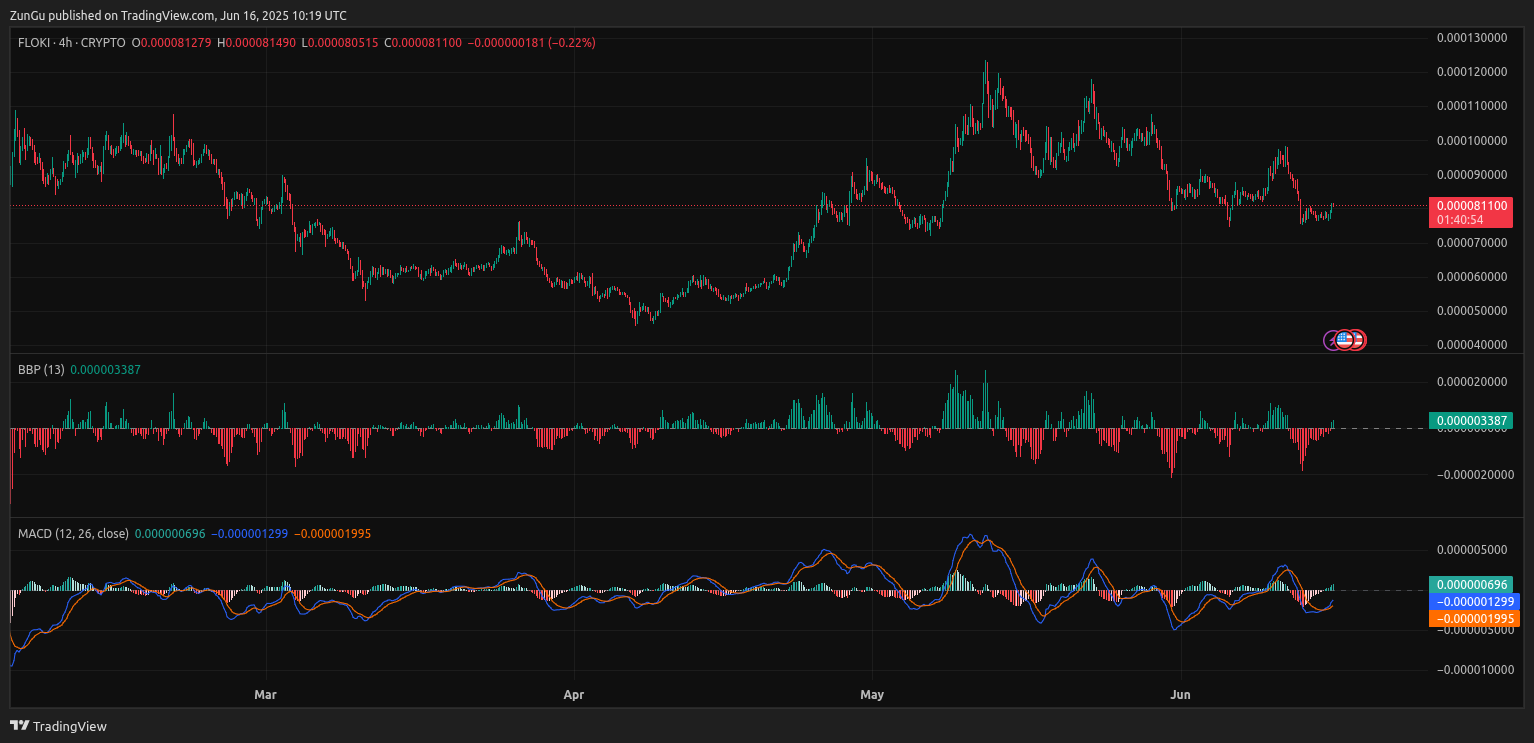
Besides, the Moving Average Convergence Divergence (MACD) is portraying an early bullish trend. The MACD line is nearing a crossover over the signal line, which is usually seen as a short-term buy signal. Nonetheless, histogram bars are still near the zero line, and momentum seems weak. Until further confirmation through volume or stronger price movement is observed, this MACD signal remains preliminary.


