

Key Insights:
- ONDO crypto is respecting a long-term weekly ascending trendline around $0.7682 with buying interest.
- Elliott Wave analysis suggests that ONDO crypto may be forming wave (1), pending confirmation of a five-wave breakout.
- ONDO crypto daily chart shows consolidation within a falling wedge and higher lows near a key demand zone.
ONDO crypto is currently consolidating within a tight range as it tests multiple significant support levels. Analysts presented varying yet structurally aligned insights, with several indicators pointing to a potential shift in market direction.
Trends indicate that continued pressure, chart structures, and momentum indicators highlight critical zones for a potential reversal or breakdown.
Analysts have further outlined the presence of both short-term and macro indicators that may eventually determine the direction of ONDO crypto.
ONDO Crypto Price Tests Long-Term Support
Analyst CryptoED has shown that ONDO crypto price persisted above a long-term rising trendline.
This blue structural line, which has been active since the first rally, is defended around Ondo price level of $0.7682. Candlestick wicks on this support indicate a buy-side interest.
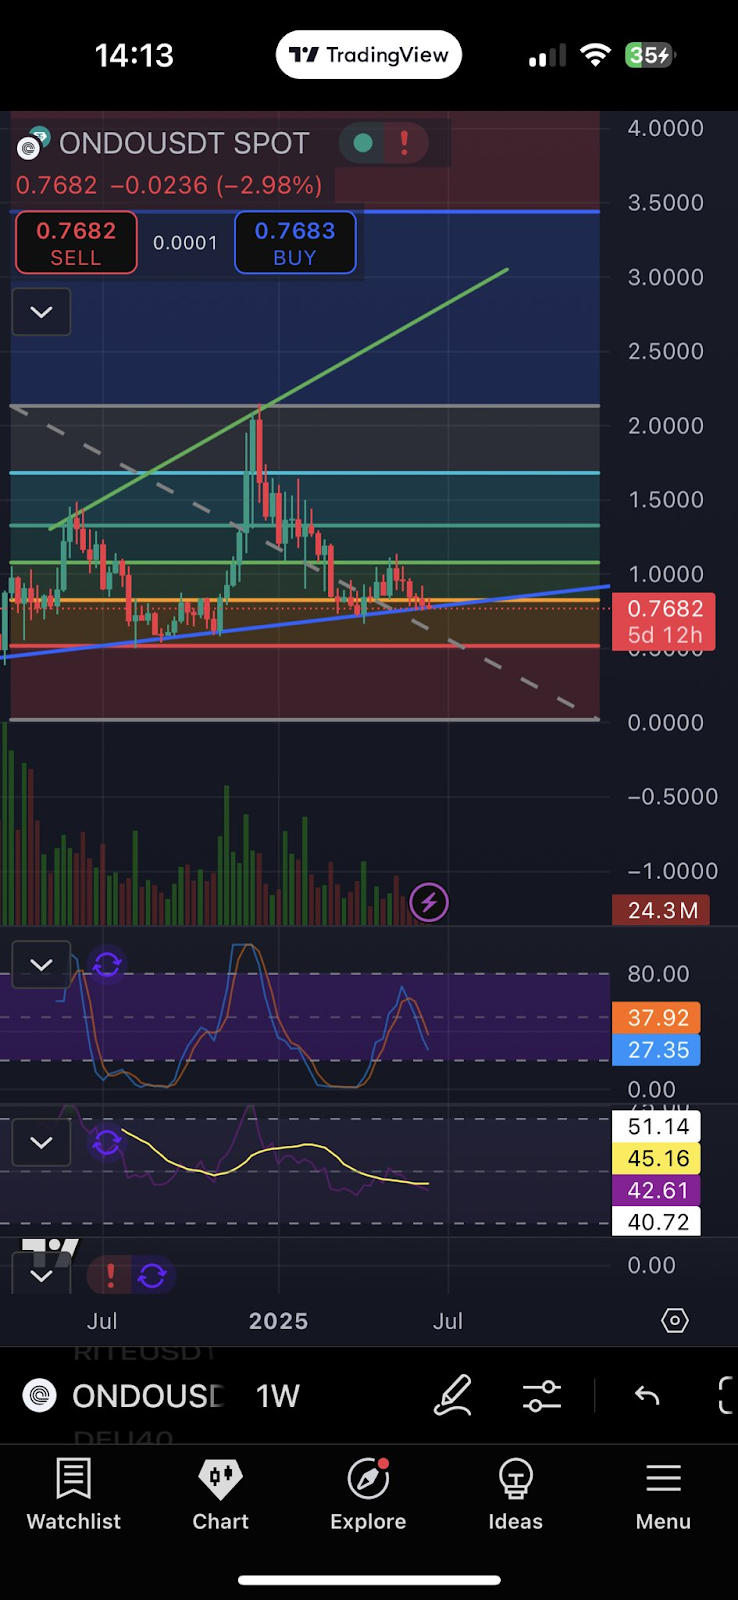
Additionally, Fibonacci retracement made on the $3.30 top to latest lows indicated that ONDO crypto price is consolidating between the 0.618 and 0.786 levels.
These are usually considered as the possible reverse points. Also, an orange dotted line aligned with a historical breakout zone adds to the technical confluence.
More so, Stochastic RSI, on the same chart, indicated a retracement nearing its lower bound. A bullish crossover may form if momentum stabilizes.
Meanwhile, RSI is flattening in the mid-40s without confirming bearish divergence. Volume remains steady, and no sharp declines are observed, suggesting the support zone may remain intact.
Elliott Wave Suggests ONDO Crypto Reversal Pending $0.92 Break
Analyst More Crypto Online’s Elliott Wave analysis on ONDO crypto chart identified a potential completion of a corrective WXY pattern.
The key support region between $0.745 and $0.815 has held. With Ondo price rebounding after a near-touch of the $0.725 level, the 100% extension for wave (C).
In addition, the rebound from the low has printed a three-wave (ABC) structure. However, the lack of a five-wave impulse indicates that a full Ondo crypto trend reversal is not yet confirmed.
Further, the chart suggested that a clean break above the $0.92 resistance level is necessary to validate the beginning of a new bullish cycle.
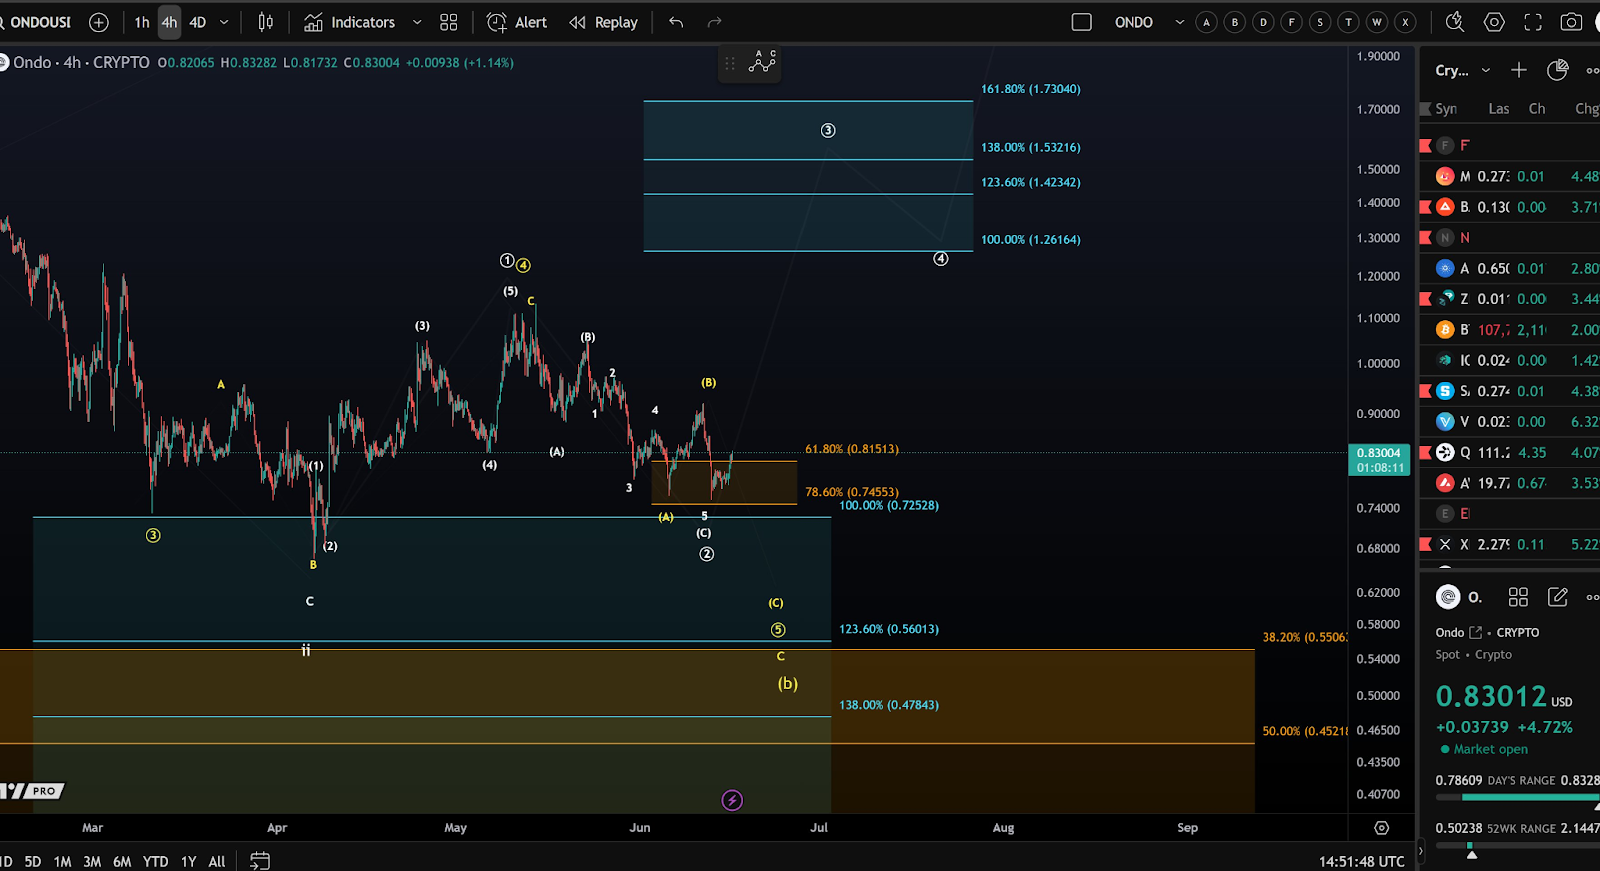
Else, Fibonacci extension projections for a possible wave (3) estimate future ONDO crypto price targets between $1.26 and $1.73.
A breakdown below $0.725, however, would invalidate the current bullish structure. This could drive Ondo price toward the $0.56–$0.45 support zone from earlier wave patterns.
Accumulation Zone Builds Foundation for ONDO Crypto Breakout
CryptoPulse’s analysis outlined a long-standing accumulation zone for ONDO crypto. The range is labeled as a “DCA & HOLD ZONE,” reflecting a historically significant demand region. Higher lows within this zone suggest potential for structural reversal.
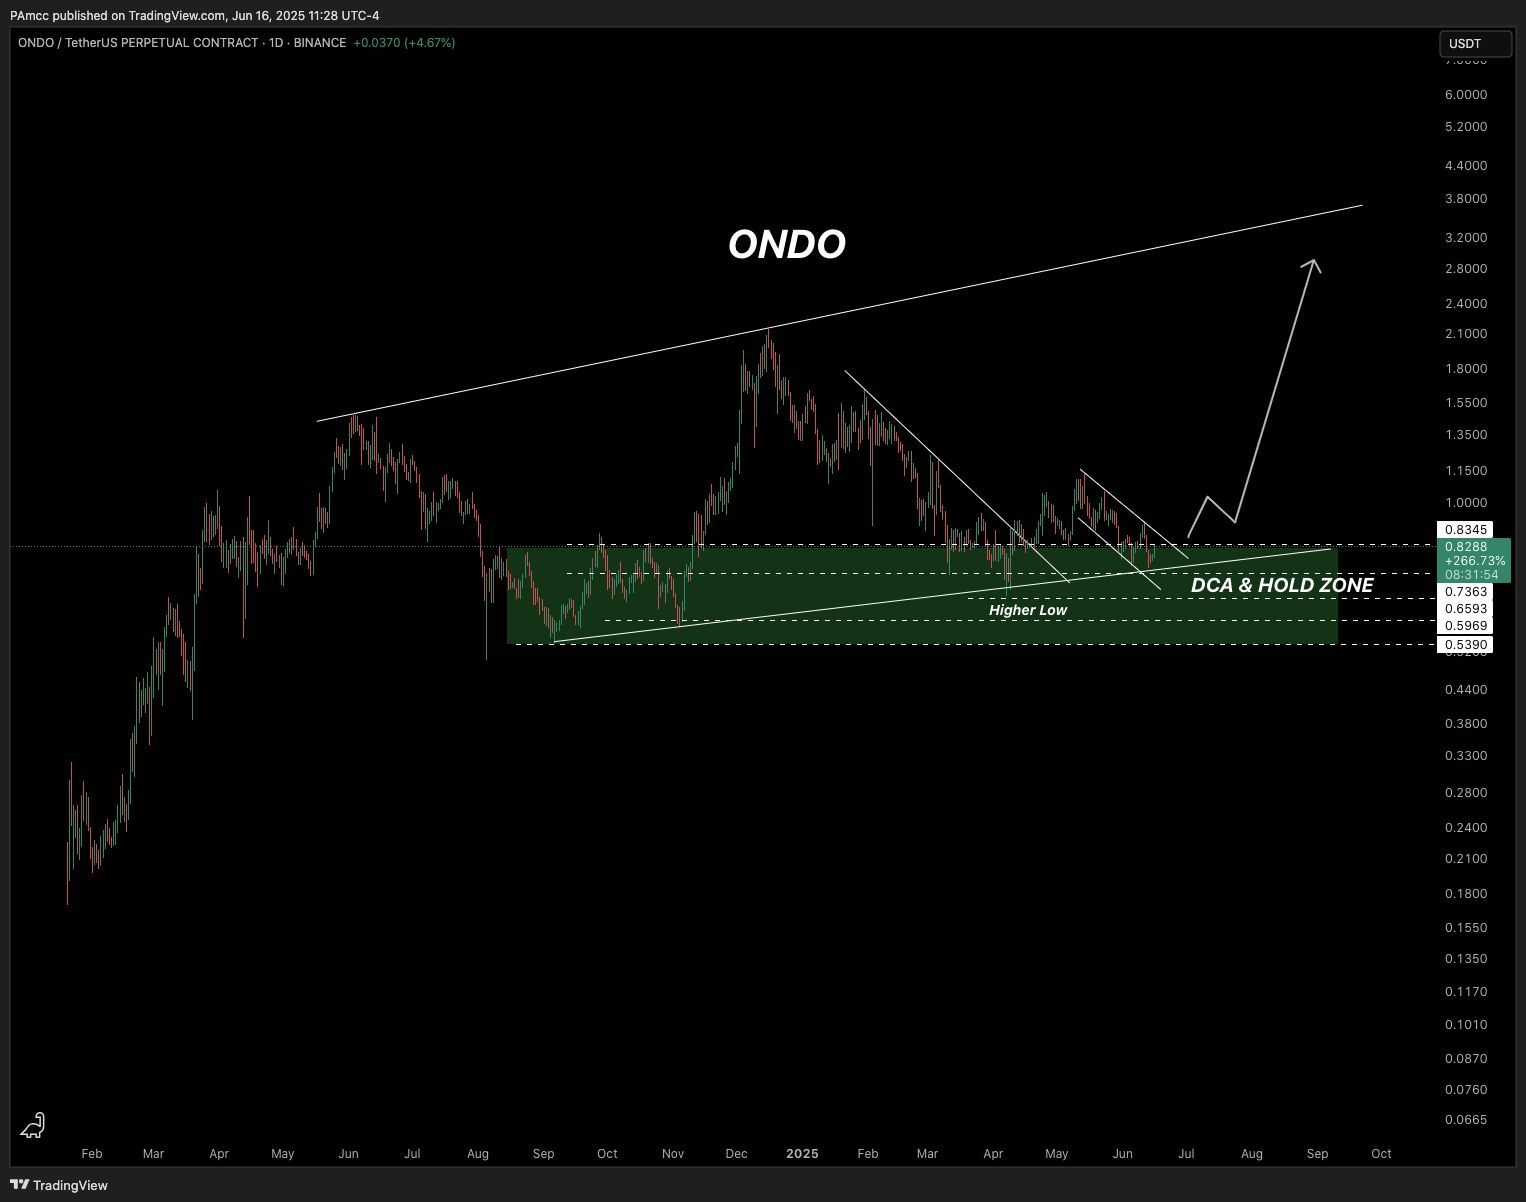
Moreover, there is a descending wedge pattern that is characteristic of the bullish continuation that is about to break out. ONDO crypto price is challenging the upper boundary of the wedge around $0.83.
A breakout may change the tides and bring investors in to buy the stock. Fading volatility, which precedes directional motion, also takes the form of the pattern.
Furthermore, the analyst made a long-term ONDO crypto rebound of $3.00, powered by the upper trendline resistance of former highs.
This corresponds to a 3.5x payback. In turn, the analyst suggested that the breakout may be followed by a pullback and a higher low prior to an upward trend that is sustained.
Short-Term Pressure Persists as ONDO Price Trades Below Mid-Band
According to further analysis, Ondo crypto is trading near the lower Bollinger Band, around $0.75347. ONDO price has recently broken below the midline (20-SMA) at $0.79273, indicating increased bearish pressure. Repeated failure to test the upper band at $0.83198 reinforces the weakness.
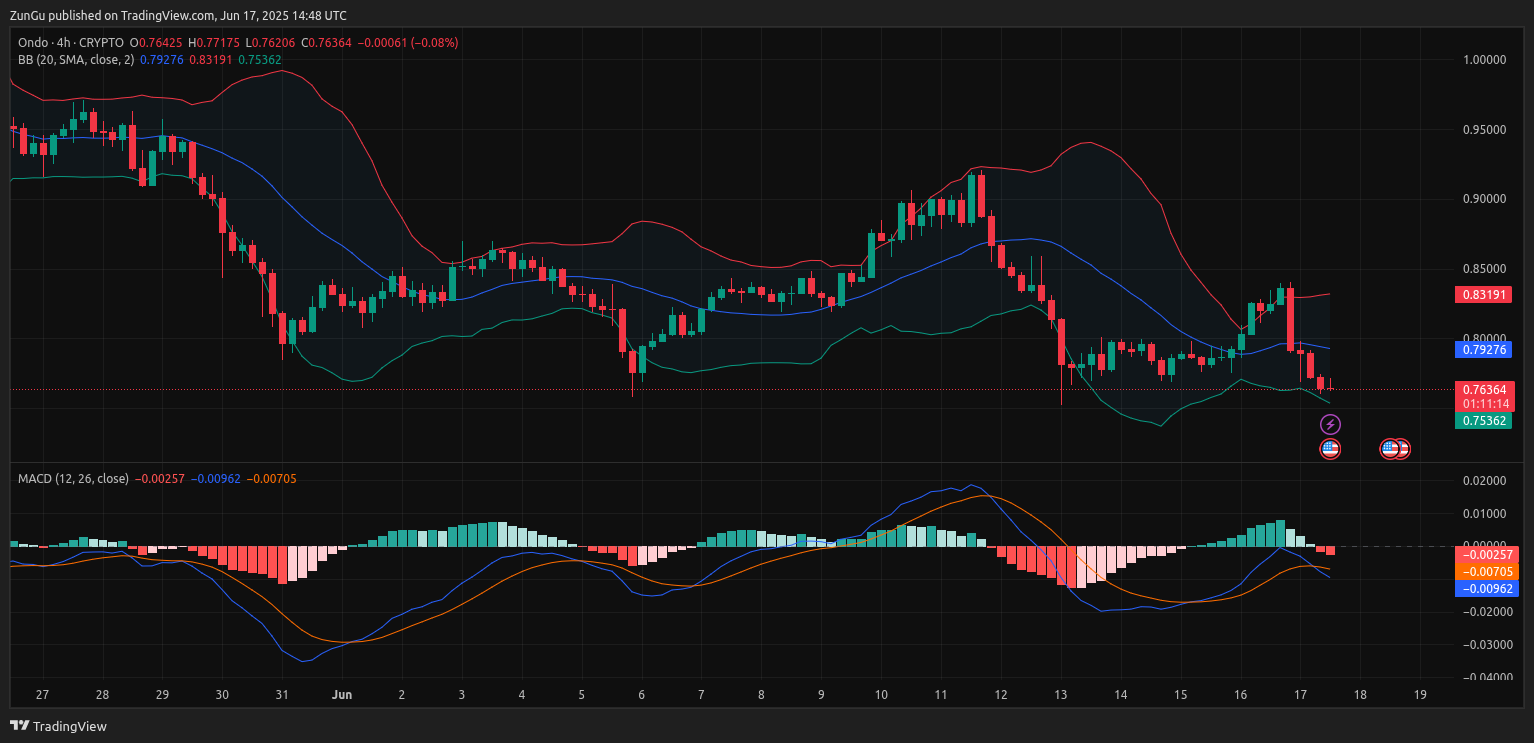
Additionally, there is negative momentum that relates to the MACD. By the most recent session, the MACD line has been disclosed at -0.00968, which is beneath the signal line as well as the zero line.
Structurally, ONDO crypto continues to post lower highs and lower lows. A failed rally attempt between June 10 and 14 capped near $0.83, confirming dynamic resistance.
Unless Ondo price reclaims the mid-Bollinger Band, near-term downside risk remains, with support again near the $0.75 level.


