

Key Insights:
- MATIC formed a rectangle pattern, signaling a breakout above the $0.195 resistance zone.
- Volume delta shows accumulation as buyers position before a potential move.
- Polygon’s fundamentals and POL upgrade support long-term bullish momentum.
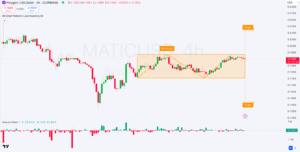
The Polygon (MATIC) price is trapped inside a rectangular structure, as all indicators point to a controlled accumulation phase before seeing another more significant move.
MATIC recovered from early April lows and has formed a transparent support and resistance zone between $0.175 and $0.195.
Two symmetrical peaks and troughs within the defined channel indicate indecision and energy coiling.
The consolidation structure of this crypto has been following a sharp decline and subsequent recovery.
This could signal a reaccumulation phase rather than distribution.
The rectangle, with its implications being a continuation pattern for a bullish or bearish breakout, etc., depending on the breakout direction of the volume, is often viewed as a continuation pattern.
Currently, the latest trading value of MATIC, at $0.1900, is functionally at the upper end of the range.
If the price closes decisively above the resistance area, we shall see a move towards the $0.21-$0.22 area, which targets the vertical height of the rectangle.
On the contrary, if it breaks out of this pattern, this would set up a test of the $0.155–$0.160 area where demand was previously placed.
Volume Delta Hints at Accumulation Underneath Calm Surface
We also saw a potential move in the volume delta indicator. Overall volume is moderate, and the number of buy imbalances increased during the upswings within the rectangle.
We saw a green delta spike of +22.64K, which shows the most significant single candle volume disparity.
This indicates an excess of buyers who are taking things seriously. Often, when volume delta and price direction don’t match, it is an early signal from institutional high-volume actors positioning themselves before volatility resumes.
Historically, we have seen such volume compression within consolidation phases succeed in moving the price directionally on Polygon.
If the same arrangement were to occur in mid-2023 and early 2024, the clear breakout would bring double-digit percentage gains within days.
With that said, traders and investors are closely monitoring how a surge in volume delta confirms these breakout confirmations.
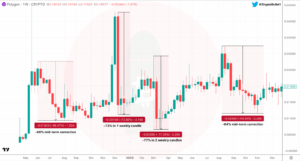
Polygon’s Price Historical Volatility Now Contrasts with Market Maturity
This is far from the early days of MATIC, and as a result, a calm but technically charged phase.
From 2019 to 2020, Polygon experienced extreme volatility, with the fourth-largest four drawdowns being over 60%, most notably our brutal 77% crash over two candles weekly.
Then, quite a few doubted if the project would become viable
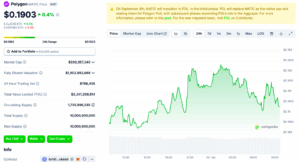
Based on CoinGecko data, Polygon’s ecosystem is fundamental and alive. The total value locked (TVL) across Polygon protocols is $5.24 Billion.
This could be seen as an indicator of DeFi engagement across the landscape despite a lack of overall market momentum.
With a $330.3 Million market capitalisation and $788,408 24-hour volume, according to CoinGecko, MATIC is in a quiet phase, with the view that it is not abandoning but an expected cooldown.
Short-Term Technicals Meet Long-Term Resilience
The 4-hour rectangle pattern is short-term uncertainty, but it also shows a longer-term picture of resilience.
MATIC’s ability to hold the $0.18–$0.19 level during a wider market downturn and add a bounce along the way shows a change in the market’s psychology.
These levels, which would have triggered panic in the market in 2019, signaled consolidation, confidence, and disciplined positioning.
The measured move from the rectangle pattern also enhances this thesis.
Bulls can push the price through the resistance and succeed with follow-through volume with a continuation of a positive volume delta.
The move would lead the price to the $0.21 resistance zone. Breaking local highs would also change a multi-week structure into a bullish breakout structure that might bring in trend followers and deposited capital.
Alternatively, if support at $0.185 is broken, the rectangle will be invalidated and expected to revisit the $0.160 region.
However, the structure is still more bearish in volume as it is an accumulation, not a distribution.
Again, Polygon is in a pivotal technical juncture. The 4-hour rectangle pattern suggests bullish short-term indecision, but historical resilience, strong fundamentals, and institutional development support a longer-term bullish bias.
Volume delta is climbing, and MATIC is just sitting below breakout territory. This may trigger the catalyst for the rectangle’s breakout.


 price forms a rectangle pattern on the 4-hour chart, signaling a potential breakout as accumulation intensifies near $0.19.)