

Key Insights:
- Stellar (XLM) has finally broken out of a prolonged bearish trend, opening the way for a massive rally.
- XLM price could soar by 30% to reach the resistance level of $0.367.
- Following the breakout, exchanges recorded nearly $2 million worth of XLM outflows, indicating potential accumulation.
XLM price has finally broken out of a prolonged descending channel pattern after experiencing a 65% downside move. This breakout reverses the bearish trend and opens the path for a potential massive upside move.
Looking at the market sentiment, the past few days have favored XLM, helping the asset break out of its strong bearish trend. At press time, XLM price was trading near $0.278 and had recorded a price surge of over 5.10% in the past 24 hours.
However, its trading volume dropped by 10% during the same period. This indicated that investors and traders were more hesitant to participate in the token than on the previous day.
The potential reason behind this low participation is the daily candle closing just above the pattern. This may only partially confirm a successful breakout.
XLM Price Action and Technical Analysis
According to expert technical analysis, XLM price appears bullish and is on the verge of a massive upside. The daily chart reveals that Stellar traded within a bearish channel pattern since November 2025, losing over 65% of its value.
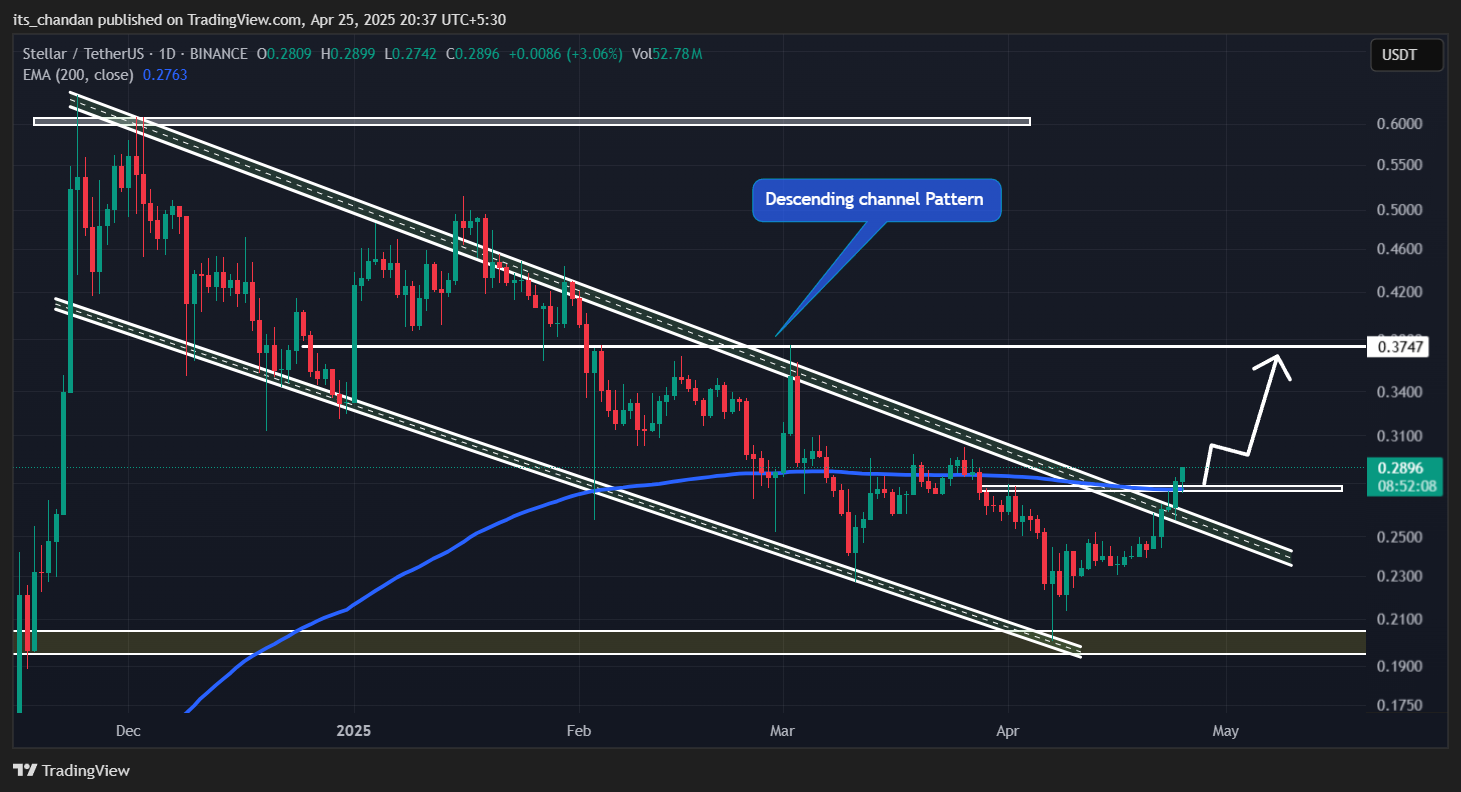
However, after hitting a key support level at $0.20, the price began a strong recovery, surging by 35%. This upward movement from the lower boundary to the channel’s upper boundary led to a breakout at press time.
If XLM closes a daily candle above $0.275, it could trigger a strong upward move. This may lead to a 30% rally, pushing the price toward $0.365 in the coming days.
However, suppose the XLM price fails to hold the breakout and forms a bearish engulfing candlestick pattern. This bearish thesis will be invalidated in that case, and the asset could turn bearish again. The token could revisit the lower boundary of the pattern.
The bullish sentiment in Stellar has strengthened due to more than just the pattern breakout. Moving above the 200-day EMA in the daily timeframe has further reinforced the uptrend. This indicated a strong bullish trend and could support the asset’s upward momentum.
Bullish On-Chain Metrics
The bullish price action has strengthened market sentiment. Traders and investors have responded with increased confidence in the asset. On-chain analytics firm Coinglass has observed strong interest in its activity.
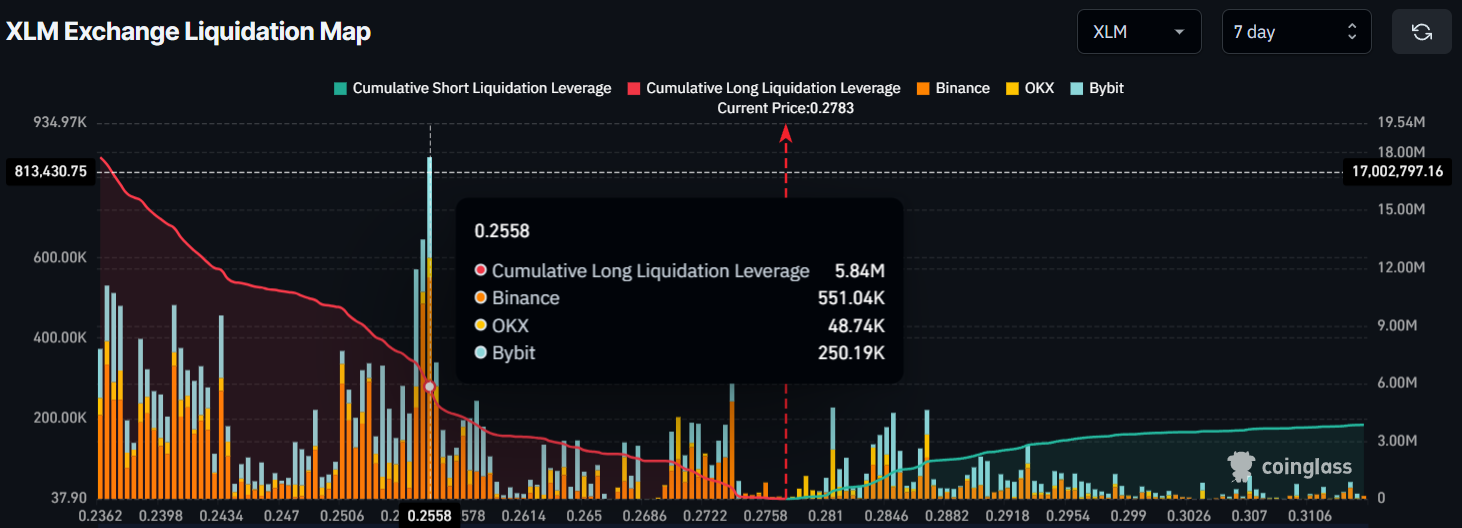
According to the XLM Exchange Liquidation Map, traders have shown strong interest and confidence in the asset over the past seven days.
They are over-leveraged at the $0.2558 level on the lower side (support), with $5.84 million worth of long positions.
Meanwhile, the $0.287 level appears to be another over-leveraged zone on the upper side (resistance), where traders have built $1.93 million worth of short positions.
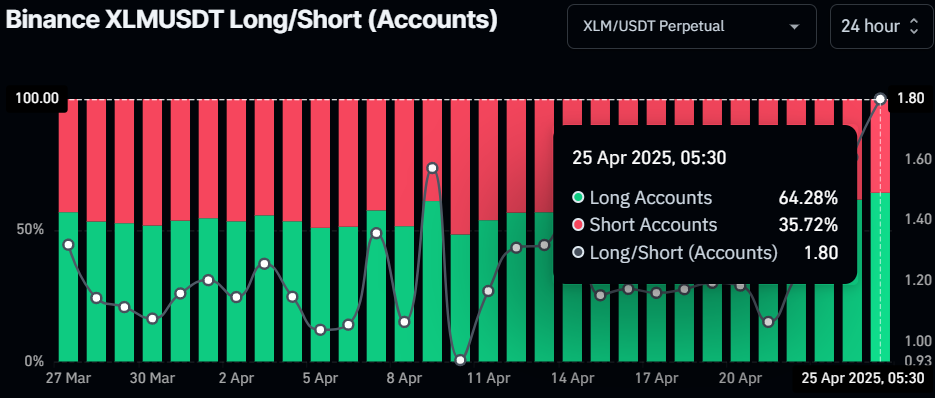
In addition to this, the Binance XLMUSDT Long/Short ratio currently stands at 1.80. This indicated strong bullish sentiment among traders.
The Long/Short ratio showed one short position for every 1.80 long positions. At press time, 64.28% of top XLM traders on Binance hold long positions, while 35.72% hold short positions.
Bulls dominate the asset when combining these on-chain metrics with the technical analysis. This could support the upward momentum of the XLM price in the coming days.


