Apecoin Price Prediction: Will Price Break Above $0.75 Or Fall Below $0.60?

- The Apecoin price prediction suggests that the movement in the asset’s price will likely occur if the consolidation breaks.
- Traders are over-leveraged at $0.675 on the lower side and $0.76 on the upper side.
Amid the ongoing market uncertainty, Apecoin price prediction has become a key focus, as the asset has been trading sideways for nearly a month. According to the daily chart, this sideways movement is occurring within a narrow range near a crucial resistance level.
As per TradingView, the asset has been facing pressure from both the horizontal barrier and the 200-day exponential moving average (EMA).
This prolonged sideways movement near a key resistance level suggests that the APE price is on the verge of a decisive move, but it may be waiting for a shift in market sentiment.
Current Apecoin Price Momentum
At press time, APE was trading near $0.70 and had experienced a modest upside momentum of 0.75% in the past 24 hours.
However, during the same period, trader and investor participation has declined. Data from CoinMarketCap shows that APE’s trading volume dropped by 20% compared to the previous day.
According to expert technical analysis, the Apecoin price prediction suggests that significant movement in the asset’s price will likely occur only if it breaks out of the prolonged consolidation.

The daily chart shows that APE has been consistently hovering between $0.60 and $0.73 since May 10, 2025. Additionally, over the past few days, the asset has attempted to break this resistance level multiple times but has failed due to heavy selling pressure.
Based on recent price action and historical momentum, if sentiment shifts and the asset breaks out of the upper range, closing a daily candle above the $0.75 level, Apecoin price prediction suggests a potential 35% rally could occur, possibly pushing the price toward the $1.06 level in the near future.
On the other hand, Apecoin price prediction suggests that the asset could decline sharply or enter a free-fall only if it closes a daily candle below the $0.60 level. If this occurs, there is a strong possibility that the asset could drop by 20% and reach the next support level at $0.47 shortly.
Apecoin Price Technical Indicator Flashes Mixed Sentiment
Amid these ups and downs, APE’s Relative Strength Index (RSI) currently stands at 56, indicating a neutral-to-slightly bullish momentum. This suggests the asset still has room for further upside before entering overbought territory.
Meanwhile, the asset price is trading below the 200-day Exponential Moving Average (EMA), indicating a prevailing long-term bearish trend and suggesting that sellers still hold the upper hand in the broader market structure.
When combining these factors, it appears that the short-term momentum suggests a potential recovery, while the long-term trend remains bearish. For a stronger bullish confirmation, APE would need to break and sustain above the 200-day EMA. Until then, rallies may face resistance, and the price is likely to remain sideways.
Traders’ Bearish Bets Continue to Rise
According to data from the on-chain analytics firm Coinglass, traders are over-leveraged at $0.675 on the lower side (support) and $0.76 on the upper side (resistance). At these levels, they have built $2.43 million worth of long positions and $5.55 million worth of short positions.
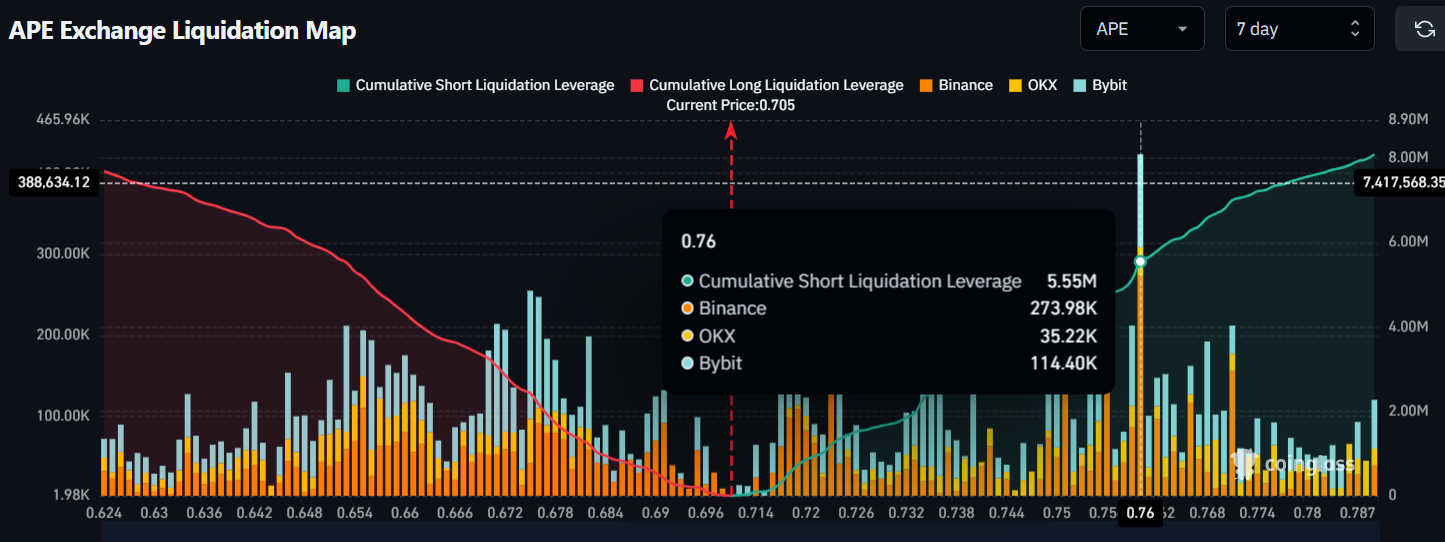
This metric was recorded over the past seven days and indicates that short sellers are currently dominant. However, these positions could be liquidated if the asset price moves significantly in either direction.


