Bonk Price Breaks Critical Support Level, Risks Further Decline

Key Insights:
- Bonk Coin breaks key support, indicating the potential for further downside.
- RSI divergence signals weakening selling pressure, but confirmation is needed.
- Bonk Coin’s price recovery depends on sustaining above support levels.
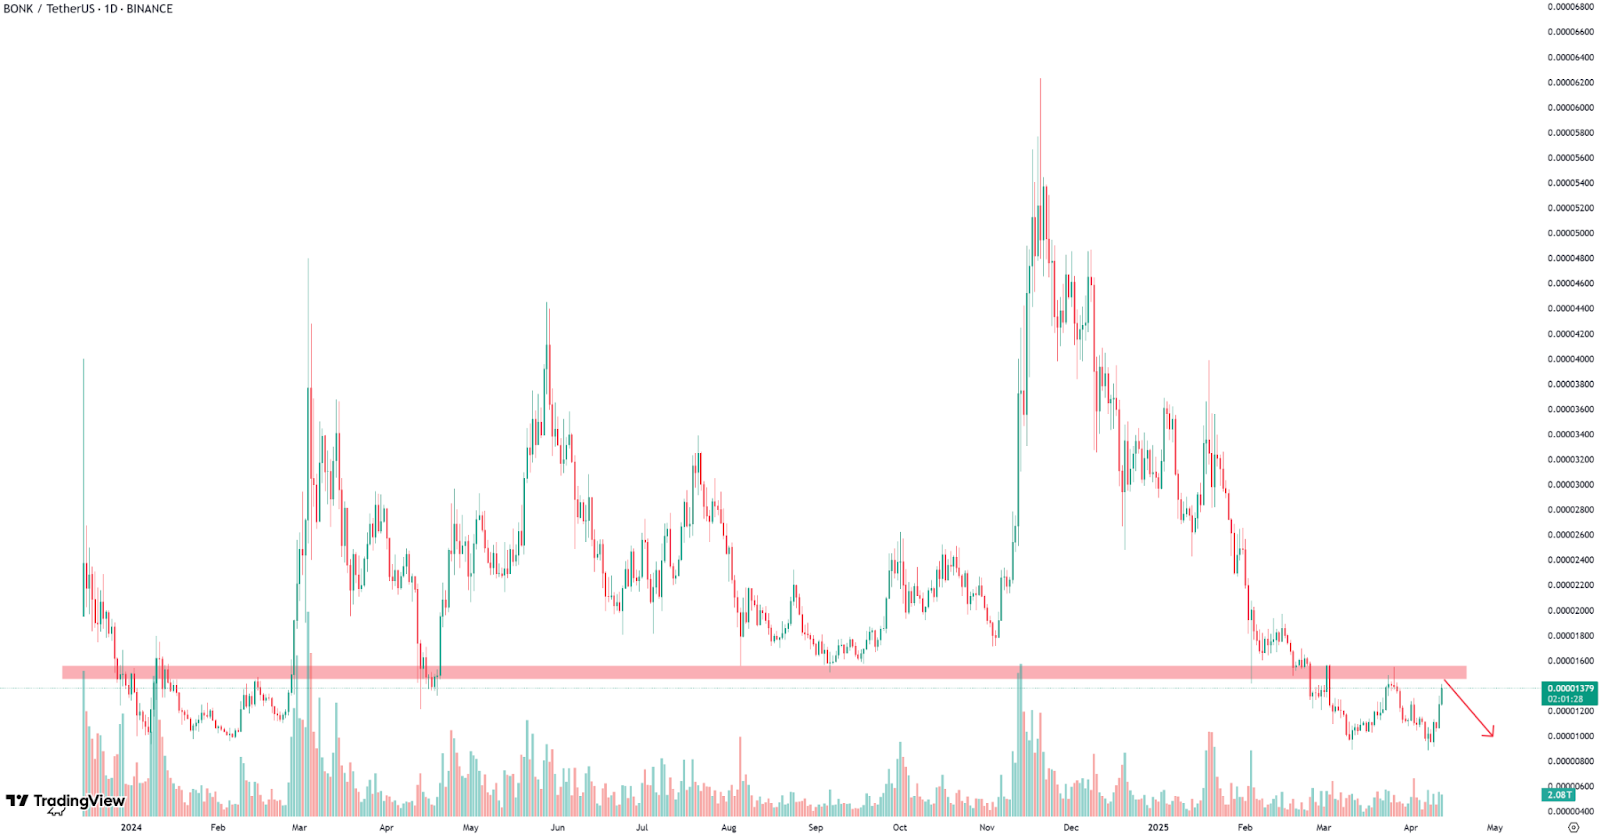
Bonk price has been on a roller coaster recently. The market is reacting to a recent breakdown below a critical support level on 1-day charts.
It failed to establish support at the current level. As a result, the price action and technical analysis suggest that further downsides could occur.
Bonk Price Analysis: Support Breakdown and Potential Reversal Ahead
The latest price action for $BONK showcased a technical breakdown below a key support level. Traders see it as an essential support area for the Bonk price. A break of a significant support level indicated control by sellers, and likely lower prices could happen.
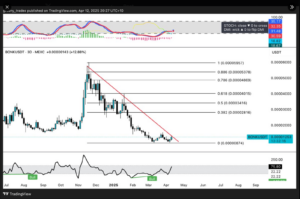
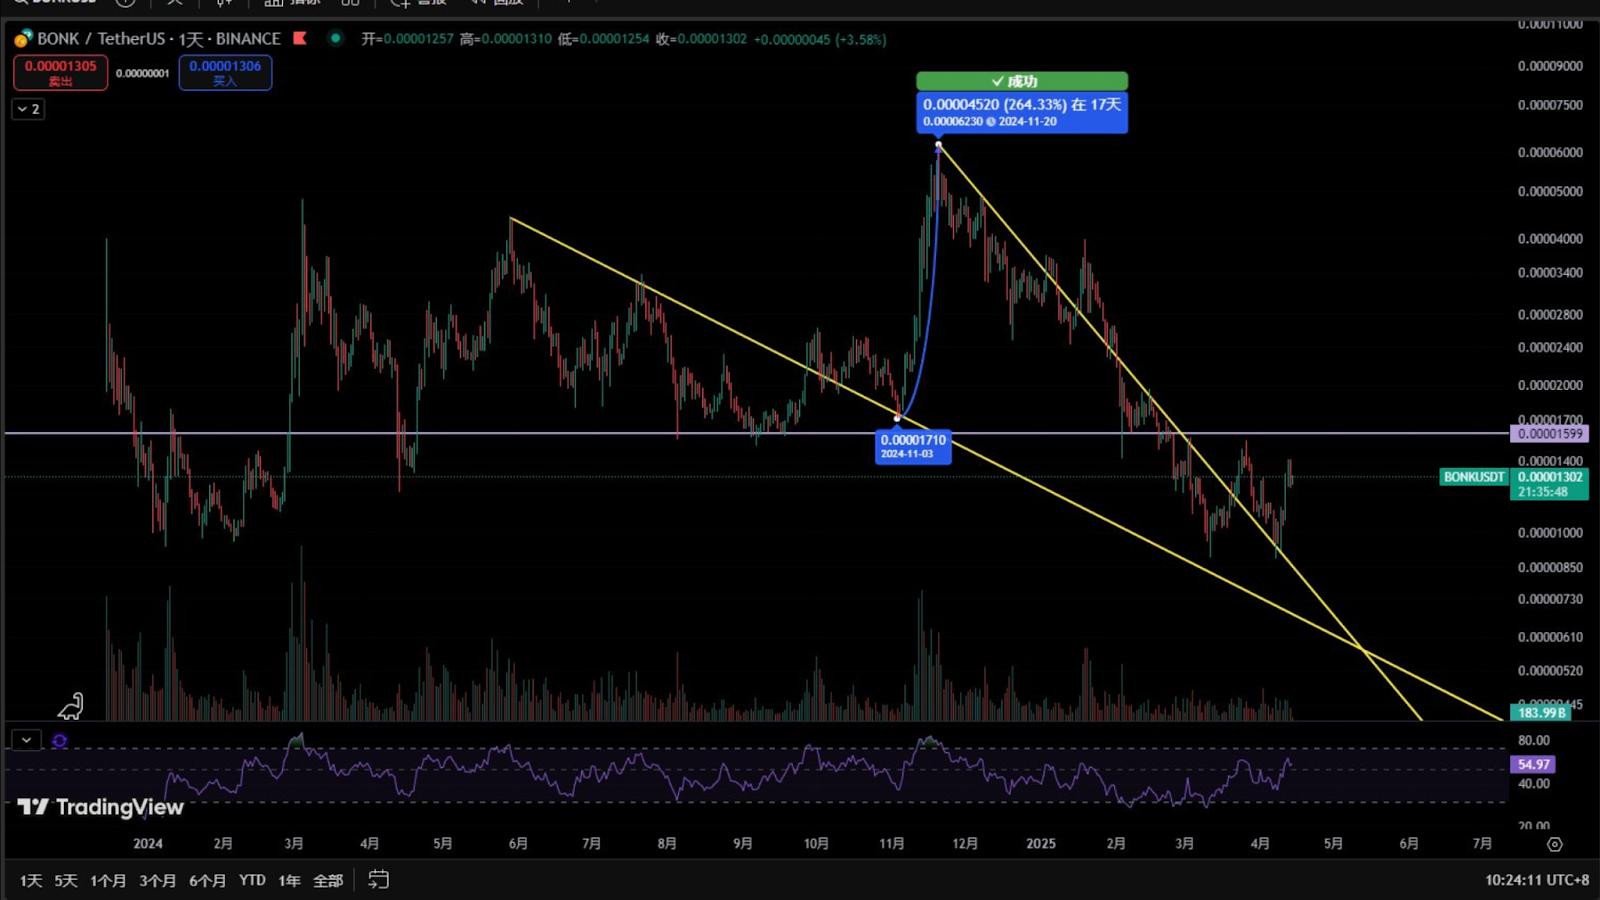
Analysts’ charts on $BONK suggested the potential for a bullish reversal. This followed a prolonged downtrend and a recent breakout from the descending resistance line.
Currently, the coin is testing important Fibonacci retracement levels with other significant support at $0.00001253 and resistance close to $0.00001400.
The analyst chart suggests that if Bonk price stays above, the next target could be 0.00001500. However, a failure to remain above the current support could decrease the price.
According to CoinMarketCap data, Bonk price has traded at $0.00001312 as of press time. This is a 2.14% valuation drop within the last 24 hours.
Although a downtrend has occurred lately, there is potential for a bounce if support is re-established. Yet, the selling pressure can be exacerbated without support in the present market conditions. This could cause the BONK to fall even further.
Will Support at $0.00001300 Trigger a Recovery?
Looking at other chart formations, the Bonk price has been in a clear downtrend. The drop has been due to high selling volume, but the sentiment for the market still seems weak.
A bounce at the support level might give a temporary respite. However, it appears unlikely that any sustained bullish move will occur unless the price can bounce back well above the support zone.
Interestingly, a divergence at the bottom of the Relative Strength Index (RSI) differs from the negative price movement. This implied that selling pressure might dissipate soon.
Therefore, this divergence reflects that the momentum behind the selling is decreasing while the price still makes new lows. Confirmation is still needed, but it is a potential sign that an upcoming price reversal is imminent.
According to the RSI and its recent price action, this is a possible buying opportunity. However, this depends on whether the market confirms a solid bounce from the support zone.
Recent technical recommendations show that such a move may occur around $0.00001599, as far as the entry point is concerned. The chart showed a possible goal price of $0.00016421, which is a 926% increase in potential.
However, further downside risk needs to be considered. Furthermore, this considerable upside suggested that a recovery could yield large gains.
$BONK has already seen volatile market sentiment with sharp price movements. At press time, $BONK trading volume was at $131.73 million, representing a 27.12% decrease in daily volume.
These factors weigh on the token’s short-term future due to traders’ lack of firm conviction and the drop in trading volume. Caution is advised as the current price is below the key support level, and negative funding rates continue to exist.
However, this support zone may not be long-lasting enough to trigger meaningful new buys. Generally, a recovery might occur if the Bonk price exceeds the $0.00001300 support level.