BONK Price Prediction: Memecoin Poised For 20% Upside Rally

Key Insights:
- BONK price prediction suggests that the meme coin is poised for a 65% upside rally.
- BONK meme coin has formed a bullish price action pattern and is on the verge of a breakout.
- Recently, the meme coin broke out from a descending trendline, pushing BONK to the key horizontal level.
BONK price has begun showing signs of recovery after a decline of over 85% in the past few weeks. During the ongoing recovery, the meme coin has surged more than 70% from its bottom at the $0.00000886 level.
BONK Price Current Momentum
Amid this upward rally, BONK price has broken out from a significant resistance level formed by a descending trendline. It has been in place since the beginning of 2025.
Meanwhile, the meme coin has reached another key resistance level. At press time, BONK was trading near $0.00001535 and had recorded a price decline of over 2.35% in the past 24 hours.
During the same period, its trading volume dropped by 50%. This indicated lower participation from traders and investors compared to previous days.
The decline in price and volume may be due to an ongoing price correction. Additionally, strong selling pressure at the current level has historically influenced market trends.
BONK Price Action and Technical Analysis
Expert technical analysis suggests that the meme coin appears bullish. However, the token faces resistance at a strong horizontal level of $0.0000159.
The daily chart revealed that the coin has broken out of a descending trendline after multiple attempts. It has also begun to shift away from the bearish trend.
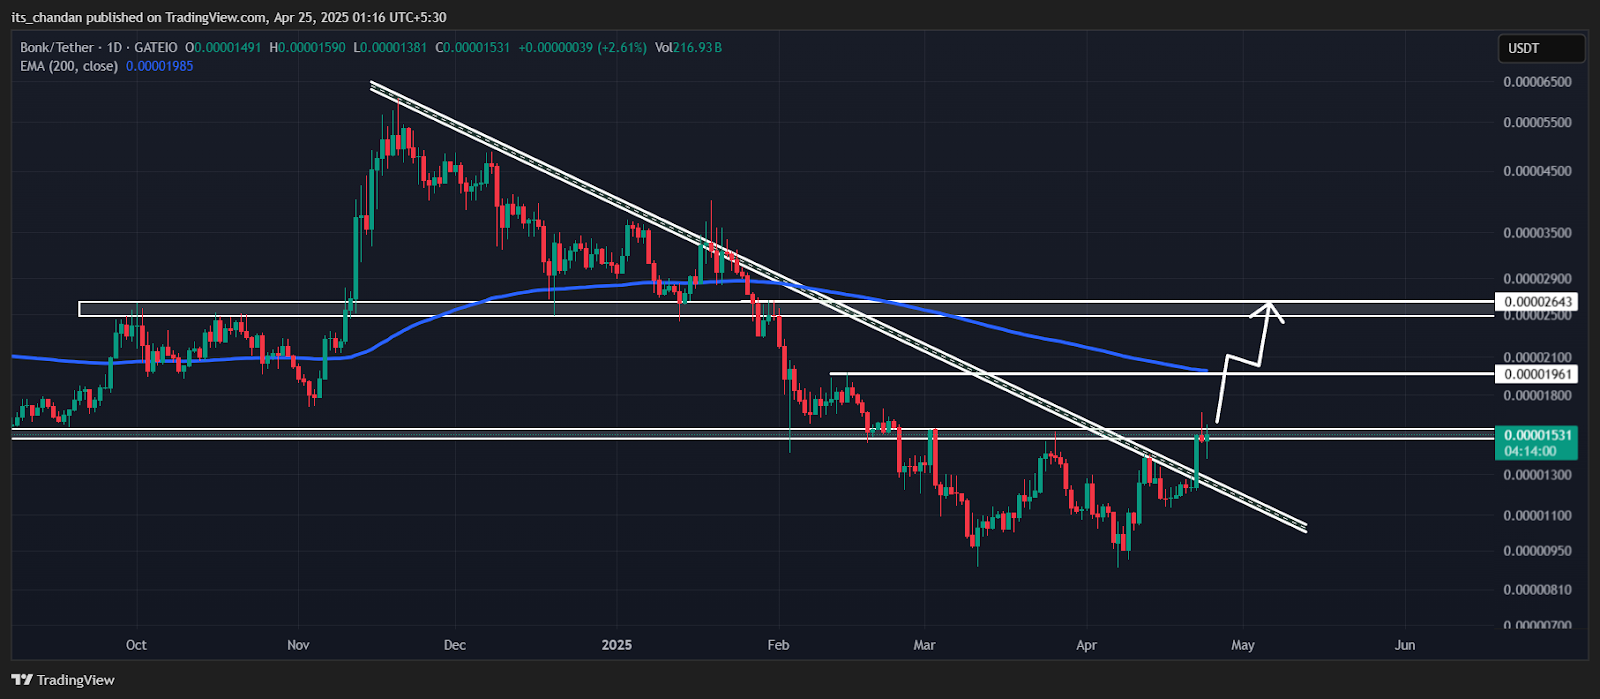
Recent price action and historical patterns suggest that a breakout above the key horizontal level could trigger strong upward momentum. The meme coin may be positioned for a massive rally if breached successfully.
If BONK closes a daily candle above $0.0000162, it could trigger a 20% surge. The next resistance level is $0.000020, which may cap further upward movement.
Meanwhile, if the upside momentum continues and BONK closes another daily candle above $0.0000205, an additional 30% rally could be seen.
The price prediction could turn bearish if BONK fails to breach the $0.0000159 level. A bearish engulfing candlestick pattern near resistance would further confirm downside risks.
Despite all these factors, the BONK price remains below the 200 Exponential Moving Average (EMA). This indicated that the asset is in a bearish trend and lacks strong momentum.
Traders and investors often use this indicator to determine whether an asset is in an uptrend or a downtrend. Based on that, they make informed decisions.
Bullish On-Chain Metrics
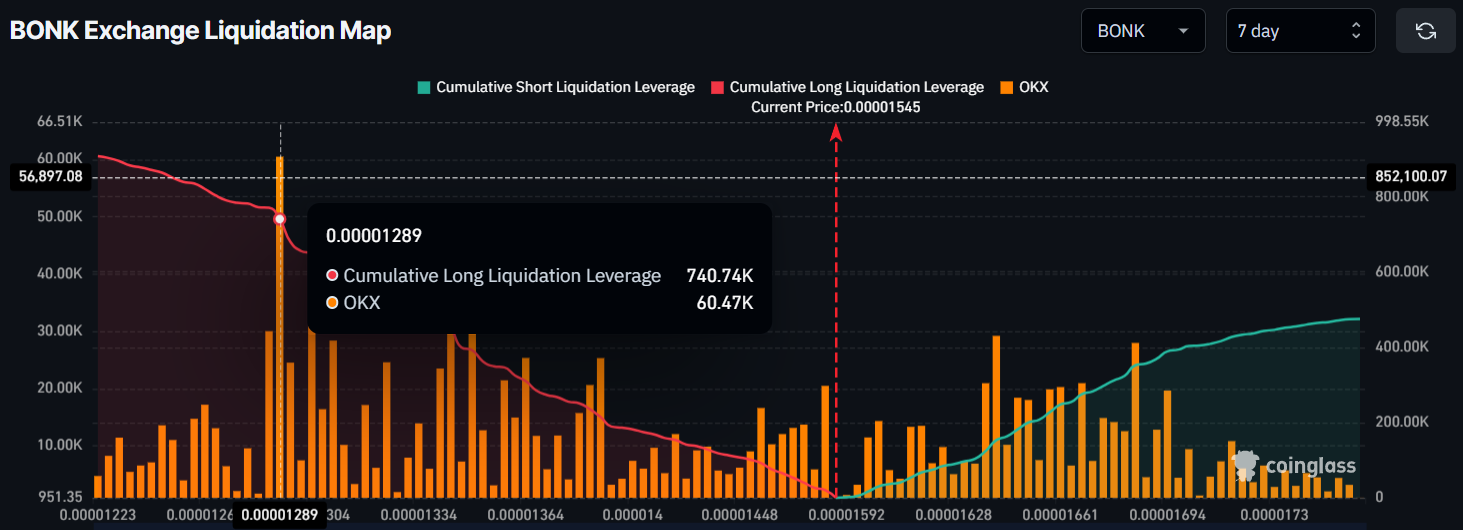
Traders and investors have displayed strong interest and bullish confidence in BONK’s price action. This sentiment was reported by the on-chain analytics firm Coinglass, highlighting growing market optimism.
On-chain metrics indicate that traders have heavily over-leveraged at the $0.00001289 level on the lower side in the past seven days. This buildup has resulted in $740.74K worth of long positions, signaling strong bullish sentiment.
Meanwhile, $0.00001685 is another over-leveraged level on the upper side, where traders have built $352K worth of short positions.
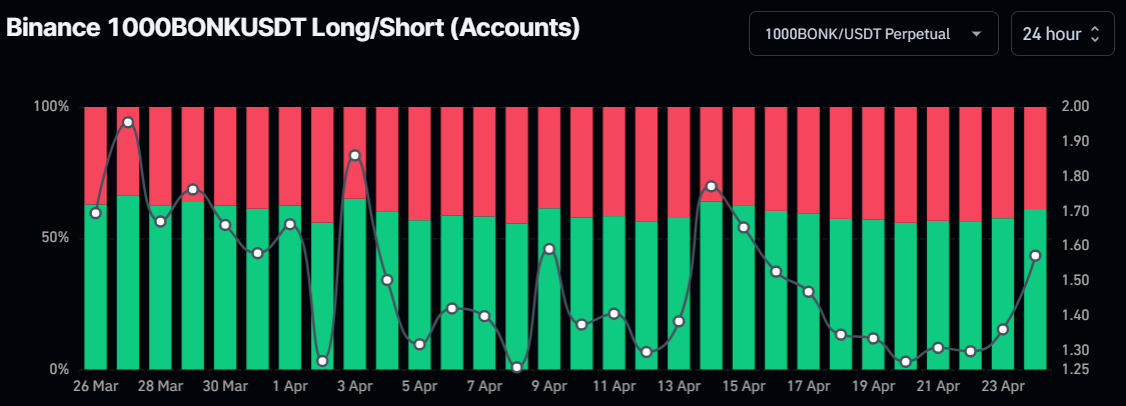
Meanwhile, the Binance BONKUSDT Long/Short ratio stood at 1.36. This indicated strong bullish sentiment among traders. This metric further revealed that 61.13% of top traders currently hold long positions, while 38.87% hold short positions.
When combining these on-chain metrics with technical analysis, it appears that bulls have consistently supported the meme coin. This explains the notable upside rally in the past few days.
If these metrics remain unchanged, bulls could maintain their dominance. This could lead to massive upside momentum for BONK price in the coming days.


