Can XLM Price Break Out To $0.43 After Key Pattern Confirmation?

Key Insights:
- Stellar (XLM) formed an inverse head and shoulders.
- Falling wedge and double bottom breakouts add strength to the bullish outlook.
- Key resistance levels could define the next significant move for XLM.
Stellar (XLM) price has attracted market attention in light of successive bullish signals, indicating potential for a change in the price movement. Notably, the latest market charts indicated a formed inverse head and shoulders setup, a confirmed double bottom setup, and a breakaway from a falling wedge setup.
Such formations suggest the upcoming big increase in XLM price, with the target at the $0.43 resistance barrier.
Inverse Head and Shoulders Signals Strong Bullish Reversal
According to Charting Guy, an inverse head and shoulders pattern has formed on the daily price chart of XLM, which is usually followed by massive trend reversals. The breakout has been confirmed by breaking above the neckline, which is a major resistance level between the shoulders.
This level at $0.304 has stopped some earlier rallies, thus, this breakout represents a very important technical point.
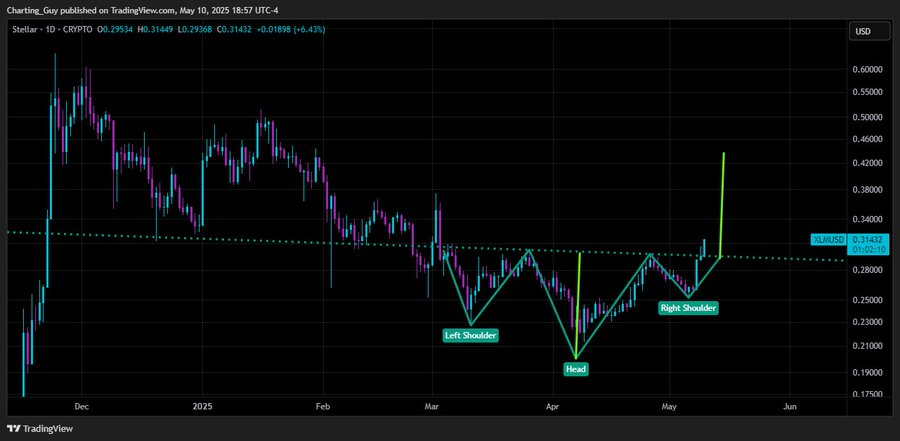
Adding the head’s height to the neckline, the measured move of the pattern implies a possible price target of $0.43, which aligns with the approaching major resistance zone.
Double Bottom Breakout Adds to Bullish Momentum
Adding to the bullish case, XLM price recently confirmed a breakout from a double bottom pattern. This structure, characterized by two significant lows at similar price levels, typically signals the end of a downtrend and the beginning of a new uptrend.
In XLM’s case, the double bottom formed near the $0.22134 support level, creating a distinct “W” shape on the 4-hour chart. The breakout above the neckline, around $0.30446, has effectively turned this former resistance into a critical support zone. This shift is significant, providing a solid base for further gains.

Traders have reacted well to the breakout, although they are attributing it as a key indicator to gain momentum beyond a major support/resistance barrier. Major support levels at $0.35149 and $0.37213, which in previous rises witnessed heavy selling, are likely to attract initial attention. If the upward pressure continues, the price move can be towards the $0.43 level that many analysts view as a major psychological and technical resistance.
Falling Wedge Breakout Confirms Bullish Outlook
XLM price has also broken out of a falling wedge, which usually indicates that the bearish sentiment is over and the bullish periods are imminent. This formation, identified by Crypto|#1 Free Signals, occurs when the price consolidates within a narrowing range, creating downward pressure that eventually gives way to a sharp upward breakout.

This upward breakout confirmed the trend reversal signal and confirmed the formation of both double bottom and inverse head and shoulders constructions. Falling wedges are significant because of their past link to strong bullish action as the selling pressure will diminish and buyers will be attracted to take advantage of the bargain.
Sustained support from buyers moving in an uptrend over these levels could trigger a long-term run above the primary goals at $0.45 and $0.50 regions. Moreover, these thresholds represent historical resistance levels, outlining significant desires for bullish traders.
Key Resistance Levels and Next Targets
As bullish indicators converge, traders dwell on the upcoming main resistance points. At $0.35149 and $0.37213, buyers will face resistance as these levels have blocked any advances in pricing in the past.
If the upward movement continues beyond these zones, a possible trend towards $0.45 and $0.50 can be witnessed since they are significant barriers psychologically and technically. These are previous historical resistance levels, which can attract bullish attention.
Moreover, trading volumes are being carefully tracked by the analysts as they are critical in confirming the strength of the market breakouts. An uptrend in volumes will be helpful to confirm the bullish view, minimize the risk of a false breakout, and support a continuation of the upward movement.


