

Key Insights:
- Cardano (ADA) appears to be forming a bullish price action pattern on the daily time frame.
- ADA could soar by 23% if it closes a daily candle above the $0.675 mark.
- On-chain metrics reveal that traders and investors have shown strong interest in the ADA token, indicating potential upside momentum.
Amid market uncertainty, ADA, the native token of the Cardano blockchain, seems to be struggling to gain momentum. However, interest from traders and investors has skyrocketed. This hints at a potential bullish Cardano price prediction in the coming days.
At press time, ADA was trading around $0.63, posting a modest 0.70% price increase over the past 24 hours. During the same period, trading volume fell by 10%, showing decreased activity. This reflects lower engagement from traders and investors compared to earlier days.
Cardano (ADA) Price Action and Technical Analysis
According to expert technical analysis and Cardano price prediction trends, ADA is poised to see a bullish trend in the coming days. As per the daily chart, the asset appears to be forming a bullish cup and handle pattern.
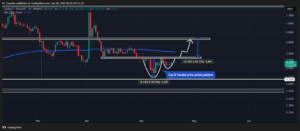
If this momentum and positive market sentiment continue, the ADA price could reach the breakout level. However, as of now, the asset’s price is still not close to that breakout point.
If ADA maintains its upward trajectory, it could break above the neckline of the bullish pattern. This breakout may signal further price growth in the coming days.
Analysts predict a potential surge of 23% for ADA. The next resistance level is expected to be around the $0.83 mark. However, Cardano price prediction could turn bearish if the current sentiment shifts and ADA fails to break out of the bullish pattern.
ADA price remained below the 200-day Exponential Moving Average (EMA) on the daily timeframe. This signals that the asset is currently experiencing a downtrend.
Bullish On-Chain Metrics
Traders and investors have demonstrated significant interest and confidence in the asset. This was highlighted in a report by the on-chain analytics firm Coinglass.
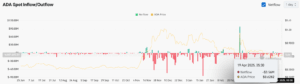
In the last 24 hours, exchanges have seen an outflow of $3.56 million in ADA, according to data from spot inflow/outflow. Such outflows from exchanges indicate potential accumulation and can lead to buying pressure and a further upside rally.
On-chain metrics highlighted that traders were significantly over-leveraged. The range spans from $0.602 (support) to $0.639 (resistance).
Over the last seven days, traders opened $22.71 million in long positions. During the same period, $8.25 million worth of short positions were initiated.
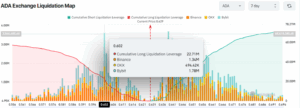
These over-leveraged positions suggest that bulls have been dominating the asset. Also, there are expectations that ADA price will not fall below the $0.602 support level.
Meanwhile, the Binance ADAUSDT long/short ratio stands at 2.10, indicating strong bullish sentiment among traders. The metric highlights a strong preference among traders for long positions.
The number of traders backing the long side significantly outweighs those favoring short positions. According to the data, 67.72% of top traders on Binance hold long positions, while 32.28% hold short positions.
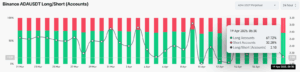
The ratio value of 2.10 reflects a significant imbalance between long and short positions. For every 2.10 long positions, traders are establishing just one short position.
When combining these on-chain metrics with technical analysis, it appears that bulls are strongly dominating the asset. They could support ADA in reaching the neckline and potentially achieving a breakout.


