Chainlink Price Prediction: Is Breakout Imminent As LINK Eyes $20 Resistance

Key Insights:
- The Chainlink price was trading just above the 200 EMA at $15.35, showing strong support amid steady consolidation.
- RSI near 48.5 with bullish divergence signals potential upward momentum for Chainlink.
- LINK’s ascending channel targets $20, indicating a possible 30% price increase from current levels.
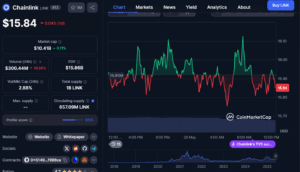
The Chainlink price (LINK) is showing signs of potential upward movement as it trades near key support levels. The current price hovers around $15.61, with technical indicators suggesting a buildup in bullish momentum.
Traders are closely watching LINK as it remains within a defined upward channel, supported by the 200 EMA and RSI patterns. This setup points toward a possible breakout targeting the $20 resistance level.
Technical Indicators Show Support and Neutral Momentum
LINK’s current price is positioned just above the 200-period Exponential Moving Average (EMA), which sits near $15.35. This level acts as a dynamic support zone, providing a base for price stability.
The fact that the price holds above this EMA suggests that short-term sellers have not yet taken control, maintaining a level of buying interest.
Relative Strength Index (RSI) on the 4-hour chart is approximately 48.50, placing it near the midpoint of the scale.
This neutral reading indicates the market is neither overbought nor oversold. Traders interpret this as a sign of equilibrium between buyers and sellers, often preceding a directional move.
Additionally, the RSI displays a bullish divergence, where price lows are steady or slightly lower, while RSI lows trend higher.
This pattern is commonly seen as a precursor to bullish momentum, suggesting that LINK might gain strength before attempting a breakout above recent highs.
Chainlink Price Movement Within an Ascending Channel
Chainlink continues to trade within a well-defined ascending channel marked by two parallel trend lines sloping upwards.
This channel has provided clear support and resistance boundaries for price action in the medium term. The lower boundary has acted as a reliable support zone around $15, confirmed by multiple bounces.
Price touching the lower boundary twice and rebounding indicates that buyers are active at this level. This repeated support strengthens the potential for upward price moves, especially if the trendline remains intact. The channel’s upward slope aligns with a bullish trend, suggesting higher price targets are possible.
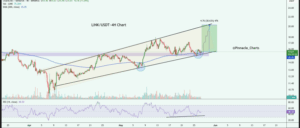
The current price consolidation within this channel reflects a smooth and steady climb, with moderate trading volume and no extreme volatility.
This pattern is consistent with a gradual build-up of buying interest ahead of a possible breakout toward the upper channel boundary near $20.
Liquidations Reflect Market Volatility and Momentum Shifts
An analysis of recent liquidations shows alternating pressure on both long and short positions, which corresponds to price swings in LINK.
Large short liquidation spikes during price rallies suggest that upward moves have been strong enough to force bearish traders out of their positions. These events typically result in rapid price increases due to short squeeze effects.
Conversely, notable long liquidation spikes occur when the price drops sharply, causing leveraged long traders to exit.
These corrections help reset the market before the next upward move. In late May, a significant long liquidation event occurred, indicating a short-term price correction.
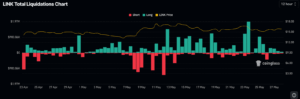
Following these liquidation events, volumes have decreased, signaling a period of consolidation and reduced volatility.
The current balance between liquidation volumes supports the observation of a neutral momentum phase with potential energy building for a breakout.
Market Sentiment and Trading Activity
The market value of LINK is still over $10 billion, thanks to average daily trading reaching about $300 million.
Market interest has not faded, as shown by the high liquidity even when the market is consolidating. Traders closed fewer deals yesterday, which shows they are still around and staying focused, but are cautious.
Activity around large transactions has gone up these days, which may signal participation from big investors. The increase in large LINK transfers seen in the data can point to bigger price moves as soon as markets start to change.
There is still a lot of social and developer involvement, especially on X, Reddit, and Telegram. The continued support suggests traders are confident in Chainlink’s foundation, which is linked to stability when prices are not changing fast.
If Bitcoin breaks above $20, observers believe it signals that buyers are returning and the market could rally.


