Dogecoin Price Forms Bullish Pennant, Targets $0.31 Amid Breakout

Key Insights
- The Dogecoin price broke out of a descending wedge at $0.232, signaling a potential bullish trend toward $0.31.
- DOGE trading volume surged 56.58% in 24 hours, hitting $3.13B, reflecting strong market activity.
- Liquidations topped $7M on April 23 and May 9 as short positions were wiped out during DOGE price spikes.
Dogecoin (DOGE) shows signs of a bullish breakout as it moves past a descending wedge pattern. The price recently crossed the $0.232 level, indicating a potential short-term upward trend. Current trading activity reflects a possible target of $0.31 based on technical indicators. Rising volume, increasing trader activity, and momentum-driven liquidations support a view of growing volatility in the DOGE market.
Dogecoin Price Breaks Above Descending Wedge Pattern
On the 1-hour chart from Binance, Dogecoin formed a descending wedge, often seen as a bullish reversal pattern. The price recently broke out from this wedge around the $0.232 level. This breakout came after a period of consolidation marked by lower highs and higher lows. The breakout may suggest a move toward higher Fibonacci levels.
Technical analysis shows Fibonacci retracement levels at $0.259, $0.294, and $0.314. If bullish momentum continues, these levels are being watched as potential resistance targets. The current price action of nearly $0.240 shows early signs of strength, supported by increased market volume.

Traders are now monitoring volume closely to confirm the breakout. If volume remains strong, DOGE may continue to move upward. However, if the breakout fails, support may be retested at $0.217 or even $0.206. The market remains volatile, and traders are advised to manage risk based on chart signals.
Liquidation Data Shows Rising Market Activity
Data from Coinglass reveals increasing DOGE liquidations in both long and short positions over recent weeks. Between mid-April and May 21, DOGE price stayed between approximately $0.13 and $0.26. Short sellers faced significant losses on April 23 and May 9. These liquidation events exceeded $7 million and coincided with price surges.
On May 19, a large liquidation occurred, reflecting a sharp price drop. This event suggests a temporary shakeout of bullish positions. Large liquidations on both sides point to high volatility in the market. Traders are reacting to quick price swings, which have increased recently.

Such data indicates uncertainty in the market, but it also shows heightened interest in DOGE. The frequent shifts between long and short liquidations suggest traders struggle to find direction. When combined with increasing volume, these liquidations may support larger upcoming price movements.
Market Metrics Reflect Strong Buying Interest
According to CoinMarketCap, DOGE is trading at $0.2395 with a 5.22% gain in the past 24 hours. Its market capitalization is now $35.77 billion, ranking it the eighth-largest cryptocurrency. The trading volume in the past 24 hours increased by 56.58%, reaching $3.13 billion. The volume-to-market cap ratio is 8.76%, reflecting active trading and liquidity.
The total and circulating supply of DOGE is 149.36 billion, with no fixed maximum supply. This inflationary supply model has not slowed recent interest in the asset. The price dipped to around $0.225 earlier but rebounded quickly to above $0.24. This rebound, supported by volume, shows strong intraday interest from buyers.
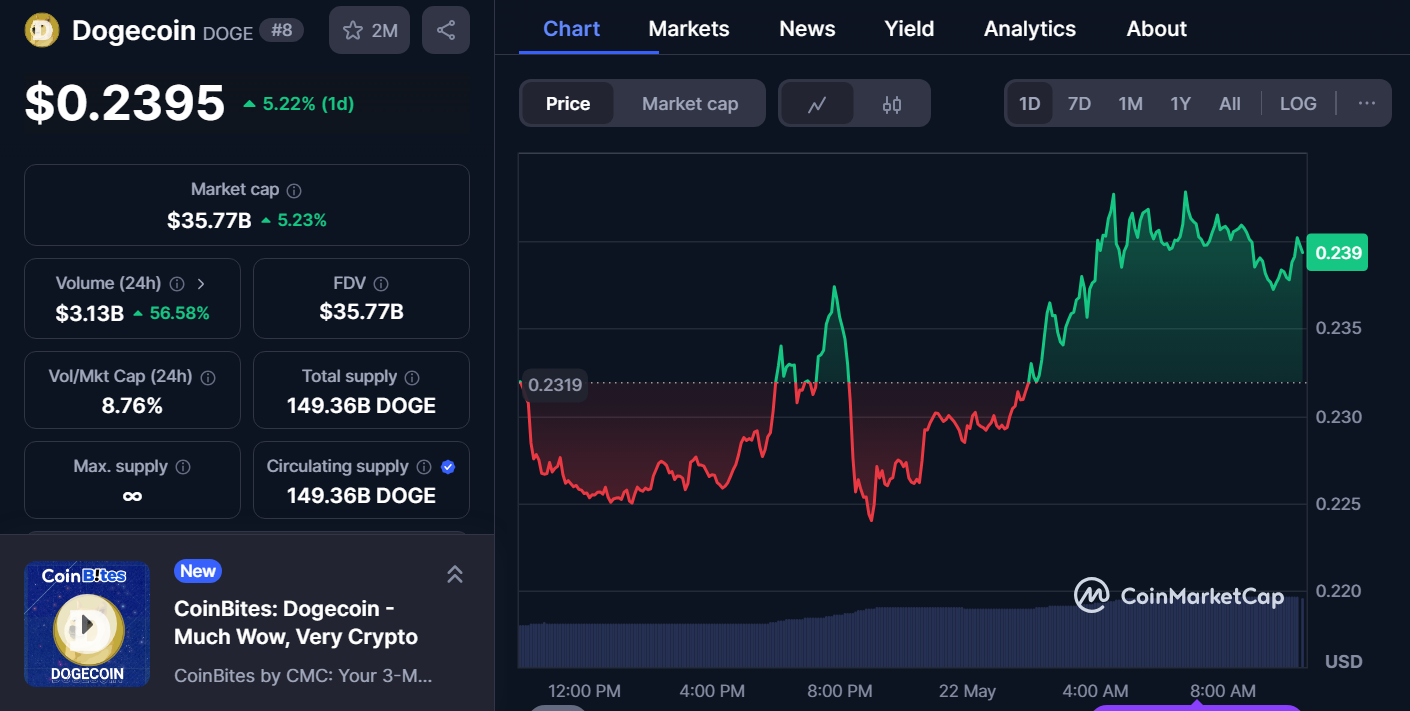
The upward move and rising volume suggest that investors are entering the market again. If this buying interest holds, the price may test upper resistance levels. Traders continue to monitor both volume and order book activity for short-term direction.
Monthly Chart Indicates Upward Momentum on the Dogecoin Price
According to the monthly chart on Coinbase, DOGE has risen by 39.80% this month and is valued at around $0.24077. At one point in the month, the price reached $0.25971; the lowest was $0.16420. Bollinger Bands and the Super Trend indicator indicate a more positive market view.
The price climbed above the middle Bollinger Band, a sign that the market may be about to break its consolidation and go up. The Super Trend exhibits support above $0.17100 and offers resistance around $0.35404. Such a difference indicates a chance for significant price changes ahead.
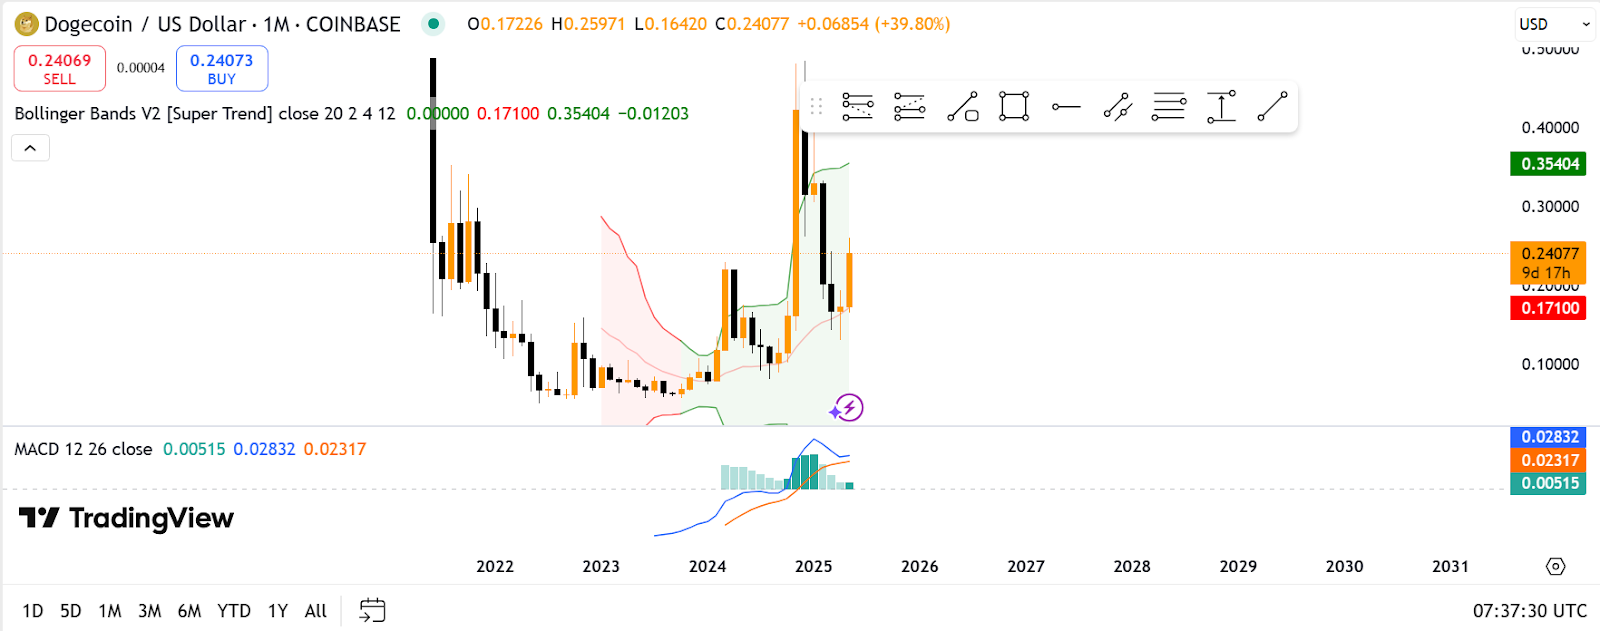
The MACD is showing a bullish crossover at the moment. Currently, the MACD line is 0.02832, the signal line is 0.02317, and positive bars are found on the histogram. This situation shows that things are gaining momentum. Traders are holding back until the monthly candle finishes to confirm the trend.
DOGE is starting to rise, according to the monthly chart. As the volume aligns with the trend, the above $0.25 and $0.31 levels could be checked for support. More long-term traders might use these levels as points in their decision-making.


