

Key Insights:
- Fantom (FTM) holds above $0.5466 with support from the 50-day MA, signalling sustained bullish momentum.
- A bullish flag formed after the breakout, with volume rising near $0.65–$0.70, indicating strong buyer interest.
- If a breakout above $0.7025 is confirmed, price targets are set at $0.8584, $0.9682, and $1.25.
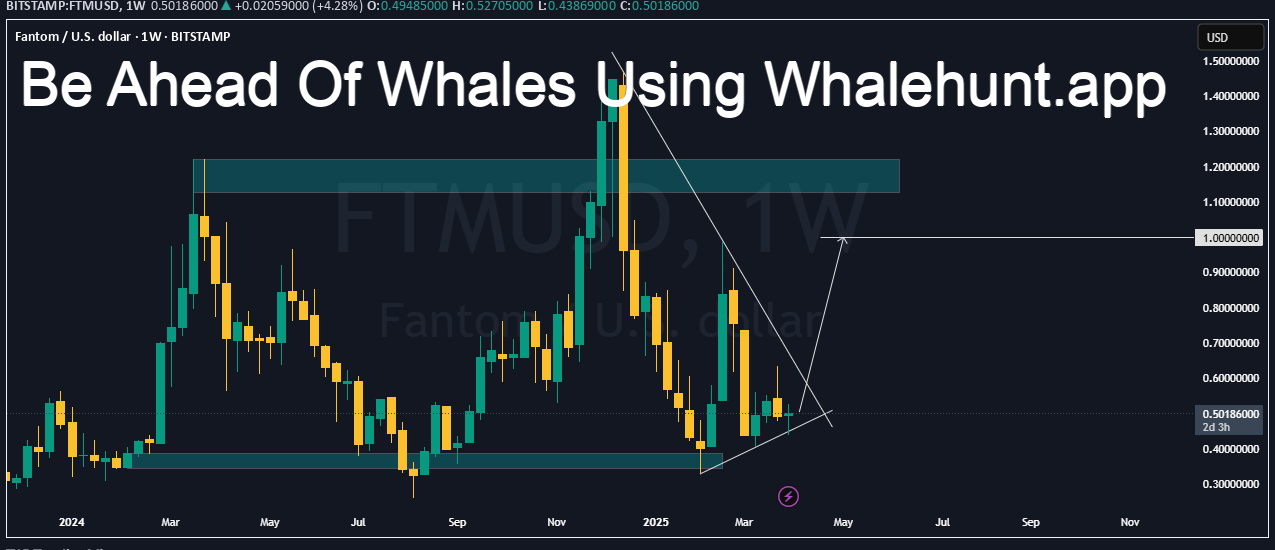
Fantom price is nearing a crucial level, trading just below $1. This movement is attracting increased interest from traders and analysts.
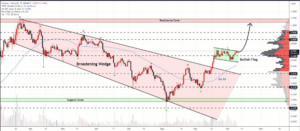
After months of consolidation within a broadening wedge, the token has made a decisive breakout. This surge is backed by increasing volume and key technical indicators.
Many are eager to see if FTM can maintain momentum and overcome resistance as bullish continuation patterns build and fundamentals coincide.
Technical Patterns Show Strengthening Bullish Structure for Fantom Price
The FTM/USDT Chart showed a potential trend reversal. Clear technical indicators on the daily and weekly charts supported this reversal.
After several months of consolidating inside a broadening wedge pattern, the Fantom price has broken above the upper resistance trendline.
This breakout was accompanied by a steady increase in trading volume, suggesting rising buying interest at key levels. The asset entered a short-term consolidation phase following the breakout, forming a bullish flag pattern.
This continuation pattern is generally seen during strong upward trends. If confirmed by a breakout above the flag, price projections may extend toward the next key resistance levels.
FTM has held above the 50-day moving average, currently around $0.5466. This moving average is trending upwards, offering dynamic support for current price action.
Volume activity has increased around the $0.65–$0.70 zone. This range showed a high volume node based on the Volume Profile (VRVP), indicating strong market interest.
If the flag pattern confirms a breakout above $0.7025, the following resistance levels to monitor are $0.8584 and $0.9682. Traders may watch these levels for potential price movements.
In an extended move, the Fantom price could approach the resistance area of $1.05 to $1.25. It has previously acted as a supply zone.
Market Sentiment and Token Fundamentals Support Potential Upside
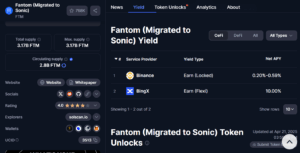
Beyond technical patterns, Fantom’s fundamentals also show favourable conditions for price stability and potential upward pressure. The circulating supply stands at 2.8 billion FTM, with a cap of 3.17 billion.
This means over 88% of tokens are already in the market, reducing the likelihood of significant inflation. Current data from staking reveals different yield options between various platforms.
The staking yield on locked Binance accounts ranges from 0.20% to 0.59% APY. However, Bingx delivers up to 10% APY with adaptable terms.
Investors stake more tokens as APY rates rise, seeking higher yield incentives. This reduces the number of tokens available for trading, tightening supply.
Fantom progresses its network with the implementation of its “Sonic” framework. The update contains changes that strengthen system performance throughout the ecosystem.
The positive market sentiment should improve with the growing adoption of new staking mechanisms and improved framework adoption. Network and user token locking activities may slowly decrease the available token supply.
Fantom Price Movement and Resistance Levels to Monitor
FTM is attempting to stay above the breakout level of $0.5466, supported by volume and trend-based indicators. The bullish flag formation remains valid if the Fantom price holds this level.
Traders closely watch the $0.7025 resistance, as a confirmed breakout could lead to accelerated gains. Fantom price action above this zone can reach both resistance marks at $0.8584 and $0.9682 throughout the short-term period.
Previous resistance zones that the price has reached now present high activity potential. Market participants maintain a close eye on the $1.05 to $1.25 price range since it holds possible selling potential.
The price pattern has formed a triangular shape, and every new breakout reinforces bullish price action. It needs careful evaluation when it surpasses $0.50.
Moving below this specific value will negatively impact the current upward trend development. The upcoming days require traders to follow both volume indicators and trendline responses.


%20breaks%20out%20of%20long-term%20wedge,%20holds%20above%20%240.50,%20eyes%20%241.00%20with%20rising%20volume%20and%20bullish%20flag%20formation.)