Fantom Price Set for Big Move, $0.65 Could Be Next Stop?

Key Insights:
- Fantom price could soar by 25% and reach $0.65 if it successfully closes a daily candle above the 0.53 level.
- On-chain metrics reveal that exchanges have witnessed an outflow of $3.34 million worth of S tokens.
- Traders are over-leveraged at $0.512 on the lower side and $0.544 on the upper side.
Sonic (S), formerly known as Fandom, appears to be struggling despite the ongoing recovery in the broader crypto market. The daily chart reveals that the Fantom price has finally broken out of the tight range in which it had been consolidating for a prolonged period, paving the way for a potential upside rally.
Current Price Momentum
At press time, Fantom was trading near $0.53 and had registered a price surge of over 4% in the past 24 hours. During this period, traders and investors showed strong interest in the token, resulting in a 15% increase in trading volume.
This surge in trading volume, combined with Fantom’s recent rally, indicates that the strength in the asset could continue to support its upside momentum.
Sonic (S) Price Action and Technical Analysis
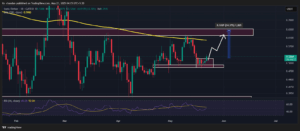
According to the TradingView chart, Fantom’s price is poised for a massive upside rally and could gain notable benefits in the ongoing bull run. On May 22, 2023, the asset finally broke out of a prolonged consolidation that had formed at the key level of $0.49.
However, the breakout has not yet been confirmed as successful, this can only be determined once S (Fantom) closes a daily candle above the $0.53 level.
Fantom Price Prediction
Based on recent price action and historical patterns, if Fantom successfully closes a daily candle above the $0.53 level, there is a strong possibility it could soar by 25% until it reaches the $0.65 mark, a strong resistance level.
On the other hand, if the S coin fails to close a candle above the $0.53 level, the asset could either continue consolidating or breach the $0.49 support and fall drastically.
With the unclear price action, Sonic’s Relative Strength Index (RSI) currently stands at 48, placing it in the neutral zone. This suggests a lack of strong buying or selling pressure. Typically, an RSI above 70 signals overbought conditions, while an RSI below 30 indicates oversold territory.
Bullish On-Chain Metrics
From an on-chain perspective, S is currently gaining strong support from the area where the majority of holders are profitable.
655 Million S Tokens between $0.44 and $0.457 Levels
The $0.44 to $0.457 range is a strong support zone, where 1,440 addresses have purchased 655 million S tokens, all holding unrealized gains. Meanwhile, the $0.51 and $0.58 levels appear to be resistance areas that could pose hurdles for Fantom’s price during an upside rally.
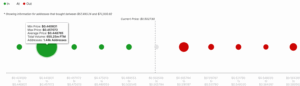
Looking at the price action and the ongoing struggle to hold the recent breakout, it appears that investors, long-term holders, and traders are accumulating tokens and betting strongly on the bullish side, as revealed by the on-chain analytics firm Coinglass.
$3.34 Million S Outflow from Exchanges
Data from the spot inflow/outflow reveals that exchanges across the globe have witnessed an outflow of $3.34 million worth of S tokens over the past 24 hours. This spot inflow/outflow metric typically indicates investor and long-term holder activity—whether they are accumulating tokens from exchanges or offloading them to exchanges.
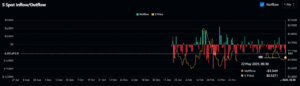
Looking at the current data, it appears that investors are potentially accumulating tokens, which could create buying pressure and drive upside momentum.
Major Liquidation Areas
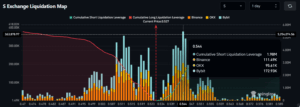
On the other hand, traders appear to be following market sentiment. Data reveals that they are currently over-leveraged at $0.512 on the lower side (support), with $2.60 million worth of long positions built. Meanwhile, $0.544 is another over-leveraged level on the upper side (resistance), where $1.98 million worth of short positions have been established.
When combining these on-chain metrics with technical analysis, it appears that bulls are currently dominating the asset, supporting the token’s ability to sustain its recent rally and breakout.