HBAR Price Reversal Ahead? Key Indicators Flash Bullish Signal
Key Insights:
- Hedera’s HBAR price is poised for a reversal, as it has formed a bullish candlestick pattern at the 61.8% Fibonacci golden zone.
- The stablecoin market cap on the Hedera Hashgraph chain has skyrocketed from $37 Million to $130 Million.
- HBAR’s price could see a 10% jump if it closes a four-hour candle above the $0.181 mark.
Following the continuous price decline in recent days, Hedera Hashgraph (HBAR) appears to be recovering and garnering significant attention from traders and investors.
On the four-hour chart, it seems that the HBAR price has found support and formed a bullish candlestick pattern at the 61.8% Fibonacci golden zone.
This price reversal from the Fibonacci golden zone appears to be a bullish sign for investors and traders.
Hedera (HBAR) Price Action & Technical Analysis
At press time, HBAR was trading near $0.175 and had recorded a modest price surge of 1.55% over the past 24 hours. Meanwhile, during the same period, this surge and price reversal signal have garnered the attention of traders and investors, leading to a 15% increase in trading volume.
This surge in trading volume aligns with the price increase, indicating strong bullish momentum and upward strength in the asset.
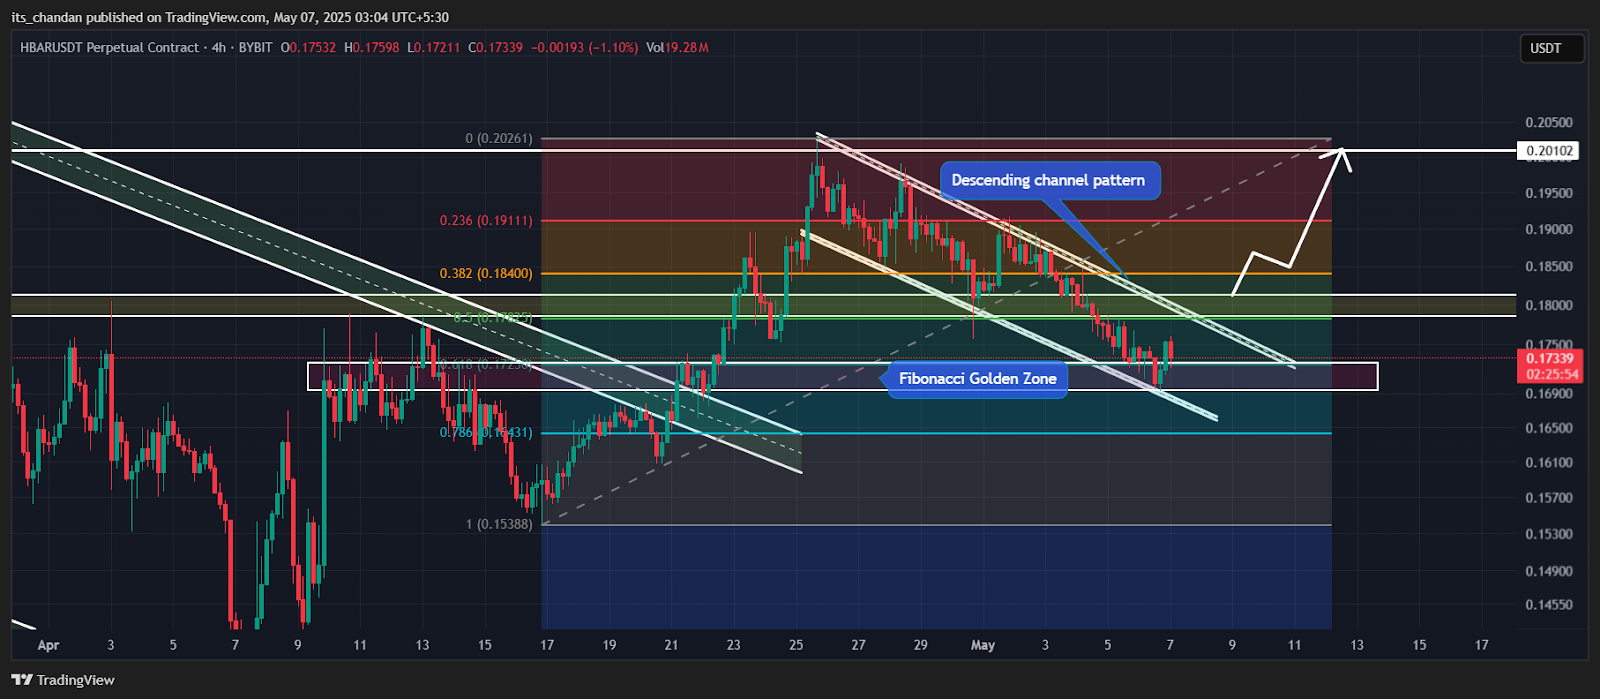
According to expert technical analysis, HBAR appears bullish and may see an impressive price reversal in the coming days. On the four-hour chart, it seems that the HBAR price has been hovering within a descending channel pattern, moving between its upper and lower boundaries.
With the recent price drop, the asset reached the lower boundary of the channel, which aligns with the Fibonacci golden zone of 61.8%. It has since formed a bullish engulfing candlestick pattern and is now heading toward the upper boundary.
HBAR Price Prediction
Based on the recent price action and historical patterns, if HBAR price holds above the $0.169 level and breaches the upper boundary of the channel pattern, it could see a price surge of over 11% until it reaches the $0.20 level in the coming days.
HBAR’s bullish thesis will only hold if it closes a four-hour candle above the $0.181 level; otherwise, we could see either price consolidation or downside momentum.
On the other hand, if HBAR price falls below the $0.169 level and closes a four-hour candle below the $0.1685 level, it could decline by 23% until it reaches the $0.128 level.
With the bullish hope in the price action, HBAR’s Relative Strength Index (RSI) currently stands at 45.15, indicating that the asset is in neutral territory, neither overbought nor oversold. An RSI around 45.15 typically suggests that the market is indecisive, with momentum leaning slightly bearish but potentially swinging either way depending on upcoming buying or selling pressure.
Surge in Hedera Network Activity
Beside this, another data that seems to be strengthting asset’s bullish outlook is the surge in the Hedera network activity. DeFiLlama data shows stablecoin market cap on the Hedera chain has soared to an all-time high of $130 Million from the YTD low of $37 Million.
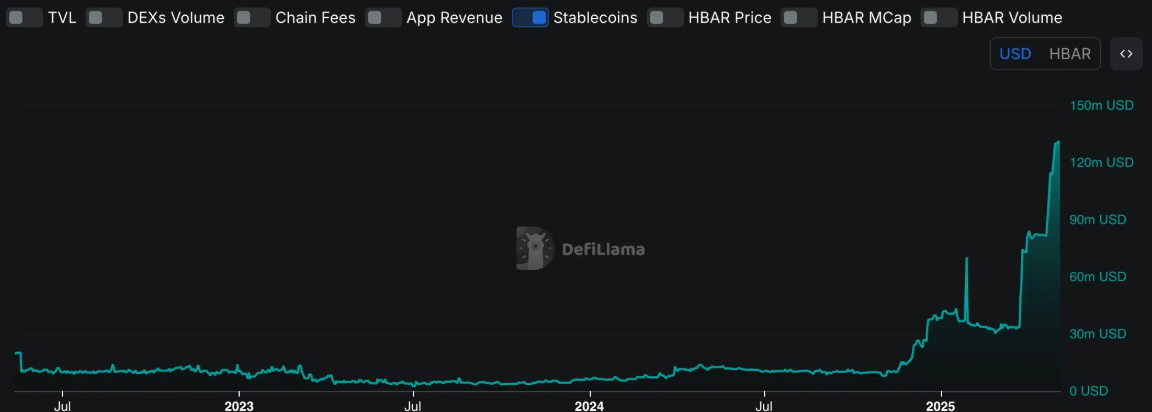
Meanwhile, Circle’s USDC seems to be dominating with a massive 99.8% share. This spike signals strong growth and rising activity across the network.
Bullish On-Chain Metric
Looking at HBAR bullish outloook, investors and long-term holders have been found accumulating the tokens, as reported by the on-chain analytics firm Coinglass.
Data from the spot inflow/outflow reveals that exchanges have witnessed a notable outflow of $2.56 million worth of HBAR tokens over the past 24 hours.
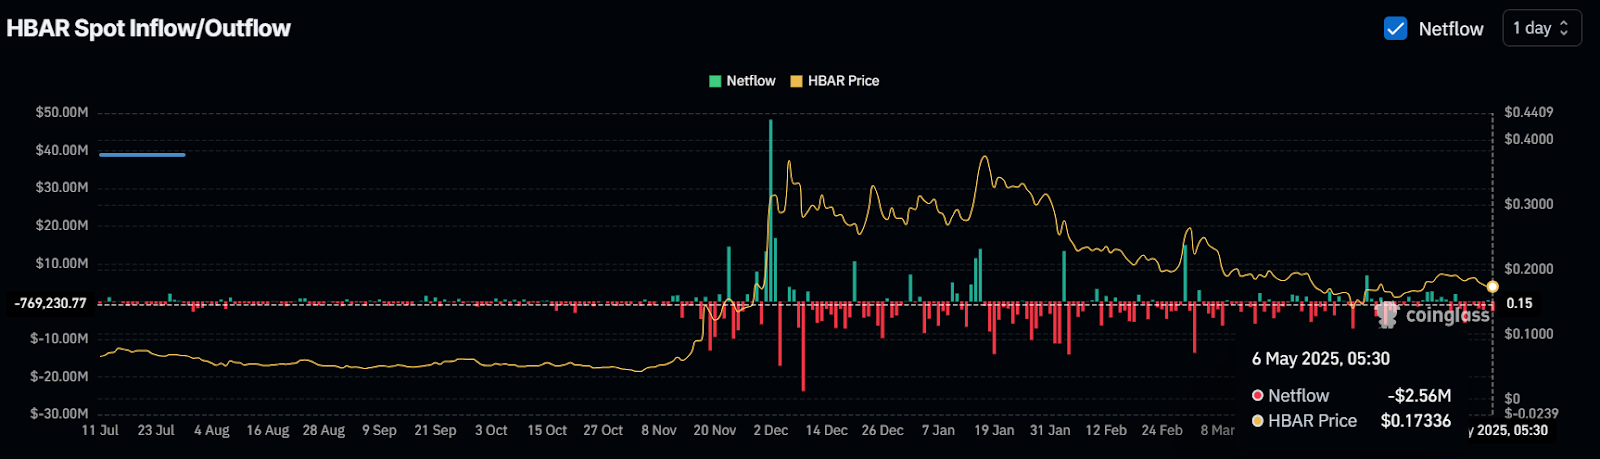
This substantial outflow from exchanges indicates a potential accumulating and can cause a buying pressure and further upside momentum.


