

Key Insights:
- Since 2017, Litecoin has failed to break the $430 resistance level, confirming it as a major long-term ceiling.
- Over 90% of Litecoin’s total supply is already in circulation, reducing future inflation risks.
- LTC has followed two identical 1,260-day cycles between major highs, suggesting a possible long-term price rhythm.
Litecoin (LTC) is again drawing attention from traders and long-term investors. Its price is trading near $85, just below crucial resistance and technical zones.
With a long history of sharp price cycles and growing on-chain adoption, it remains to be seen if Litecoin can reach $500 by 2030.
A closer look at the price action, key technical indicators, and market dynamics may provide some answers.
Current Technical Setup Suggests Short-Term Pressure
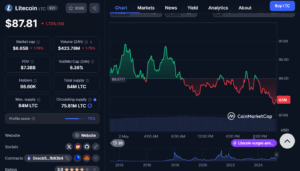
Litecoin (LTC) is currently priced at $87.81, which is -1.73% lower than its value in the last 24 hours and has a market capitalization of $6,650,669,256.
The asset resides in 21st place amongst the digital currencies and has stable trading volumes, as it recorded $423,780,524 in trading volume within the last 24 hours.
It notes that the currently in circulation is 75.81million out of a total 84 million; thereby indicating that majority of it has already been in circulation, thus contending with the issue of inflation in circulation.
The previous peaks, nearly $420–430, have not broken since 2017. This zone has become a strong resistance level.
Litecoin must decisively break above this zone to move toward a price target of $500 or more. A high volume weekly or bi-weekly close above $430 would be a key milestone.
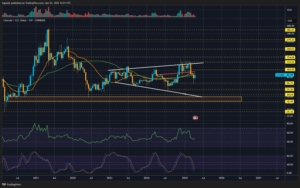
To shift bullish, LTC must reclaim $103 and key moving averages. Until then, the short-term outlook remains bearish as momentum and sentiment stay weak.
Historical Cycles and Long-Term Potential
Litecoin’s price movement is repeating, with two identical 1,260-day cycles recorded between major tops.
These cycles span roughly 3.5 years and suggest that LTC’s price may follow a long-term rhythm. Analysts often view such repeating cycles as signals for potential future rallies.
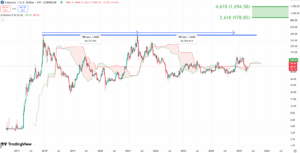
The previous peaks, which were nearly $420–430, have not broken since 2017. This zone has become a strong resistance level.
Litecoin must decisively break above this zone to move toward a price target of $500 or more. A high volume weekly or bi-weekly close above $430 would be a key milestone.
Based on the last full bull cycle, long-term Fibonacci extension levels suggest high targets of $978 and $1,694.
These levels could only be achieved if LTC enters a parabolic uptrend similar to 2017 or 2021. Such a move would require broad market support and renewed interest in proof-of-work assets.
Liquidation and Market Sentiment Trends
Data from Coinglass shows that liquidation activity has been intense during significant price swings.
Large, long liquidations, both over $17 Million, were seen in December 2023 and April 2025. These events caused sharp drops, discouraging new buying from traders using high leverage.
Short liquidations have been less frequent but suggest that when bulls regain control, the price responds quickly.
Notably, price surges in January and February 2025 followed smaller but sharp liquidations of short positions. However, late April saw muted liquidation levels for long and short traders.
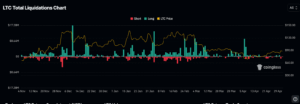
This shift suggests that many market participants are reducing leverage and waiting for clearer signals. $85 and $90 is likely to serve as a consolidation phase. The next breakout or breakdown could set the direction for several months.
LTC Price Forecast Between 2025 and 2030
Litecoin is trading with 90% of its total supply already in circulation, which limits future inflation risks.
With a circulating supply of over 75.8 million out of a total of 84 million LTC, the asset is entering a mature phase. This may attract longer-term investors seeking stability over speculative gains.
However, the price must cross $430 and form support above this level before a move to $500 and other levels can be considered.
Without this, the price may remain within the $60 and $120 range, with range-bound volatility driven by the broader crypto market and macroeconomic factors.
However, if the long-term cycle swings into effect and LTC once again demonstrates the same pattern as in previous bullish trends, then, the cryptocurrency might rise to $500 by 2027-2029.
Moreover, price targets near $1,000 are possible only in conditions of extremely bullish phases.
Until an outbreak happens, the buyers and holders will stare at particular resistance levels for guidance.


