Polygon Price Prediction: Can POL Hold $0.236 and Rally to $0.26?

Key Insights
Polygon price prediction shows bullish potential above $0.24000, but $0.23600 remains a critical support zone.
- We observed that POL prices once rose to $0.95000 and then dropped dramatically, suggesting that confidence in the crypto is not very stable.
- Half of all traders had a negative stance in POL, which suggests there is not much confidence that the price to keep rising.
Polygon price prediction indicates that the POL token has climbed past $0.24000, showing recent gains. However, staying above $0.23600 is essential to avoid bearish pressure.
Market volatility and divided trader sentiment indicate uncertainty, with potential for upward movement and consolidation. This analysis explores key trends shaping Polygon’s outlook and the possible scenarios for price action ahead.
Polygon Price Prediction: Bullish Breakout Sparks Reversal Hopes
Polygon price prediction analysis on the 1-hour chart uncovered a descending triangle. It was shaped by a line near $0.23300 and a horizontally falling trendline from around $0.28000.
The bearish surge in falling markets showed that price pressure would continue and that accumulation was below the resistance point.
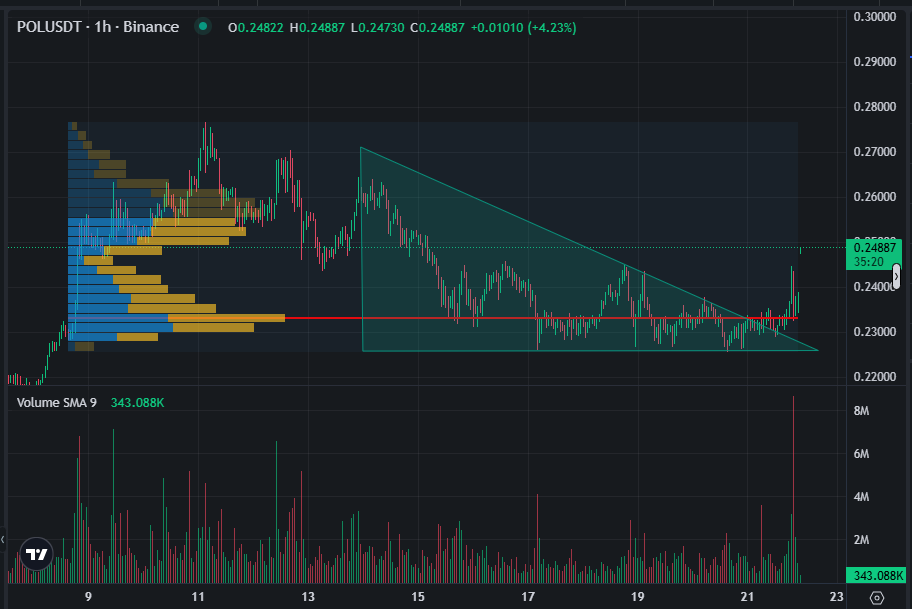
However, sentiment changed when the price surged to $0.24887, breaking through the falling resistance after reaching $0.24000. The trading volume surged past 8 million, suggesting a potential reversal.
This could have signaled the beginning of a bullish rally aiming for $0.26000 or $0.27000. An increase in trading activity was key to this optimism, averaging 343.088K over nine periods. This indicated the market was busier.
In addition, $0.23600 was a key support point due to the high volume there. If the price had dropped below 0.4130, bears might have stepped in and sent the price down to $0.22500.
A rise above $0.24000 suggests buying interest. However, the outlook strengthens only if it stays above $0.23600.
Price Volatility within Fragile Confidence
Before, the POL/USDT chart indicated a descending triangle formation at $0.24000. More Polygon price prediction analysis found that the Short-Term Bubble Risk metric became bearish at 0.819 by May 2025.
Polygon’s value rose to $0.24887, experiencing wild fluctuations. It briefly hit $0.95000 in November 2024, as shown by the yellow and orange risk bars (1.25–1.75).
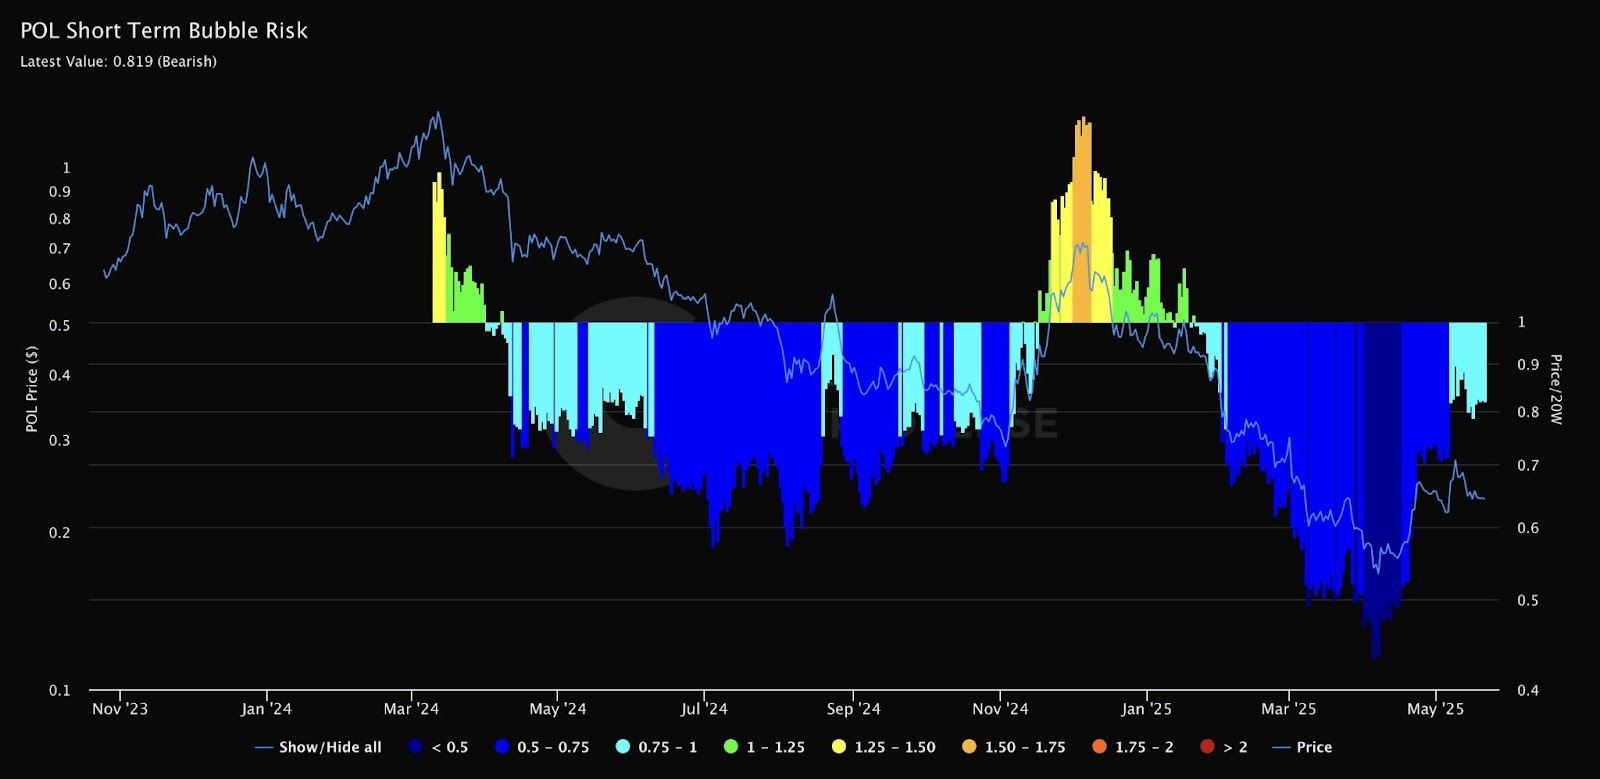
With the price so high, analysts predicted that a correction could happen. By May 2025, POL was selling for just $0.40000, as seen by the blue risk bar (0.75). This showed a low chance of a bubble and no strong bullish trend.
Going up and then down may indicate that the market is becoming volatile. If the price remains over $0.40000, it could target $0.50000. However, a fall below $0.40000 could result in another attempt at $0.30000 because of new bearish energy.
Price Volatility Clouds Polygon Price Prediction Outlook
Further, leading up to 22 May 2025, the POLUSDT sentiment picture became increasingly complex. At that point, 47.89% of traders held long positions. Meanwhile, 52.11% remained short, revealing a modest but significant bearish edge.
The resulting ratio of 0.919 suggested that trader conviction leaned toward continued downside. This weakened the momentum behind the earlier rally above $0.24000.
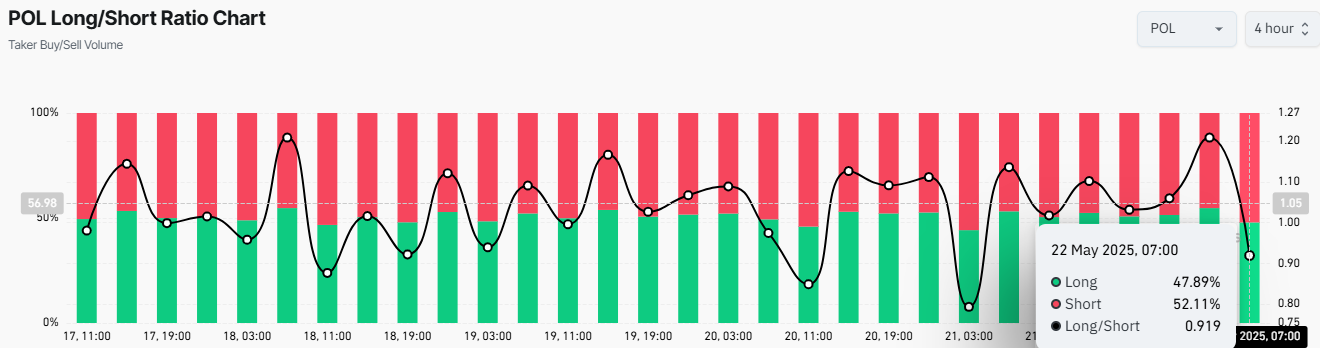
Throughout the previous days, emotional swings saw the ratio reach as high as 1.20, including on 18 May when buying volume briefly rose above selling volume.
Still, the move didn’t last long, with the market quickly resuming its bearish stance. Uncertainty was visible in the shifting moods, which might result in market consolidation near the $0.23600 level.
If short dominance remained and the ratio didn’t reach 1.00, a move down to around $0.22500 would have been possible.
Per Polygon price prediction trends, a recovery over 1.10 and higher long interest could have encouraged another move toward $0.25. If momentum continued, the price might have even reached $0.26. It appeared that a change in direction might happen soon.


