Polygon Price Prediction: POL Eyes $0.25 After Breakout
Key Insights:
- Polygon traded at $0.26 after breaking above the $0.25 resistance; breaking below it would signify continuation of the sell.
- Polygon’s Total value locked was at $751M, which was the lowest since 2021.
- Polygon liquidation heatmap suggested potential rise to around $0.27.
After overcoming a great diagonal resistance line, the price of Polygon (POL) busted up to $0.2633.
Polygon price connected a trendline from one peak to another peak recorded in early March and early April, and acted as a resistance barrier above the $0.25–$ 0.255 range.
Polygon Price Prediction
The latest upward surge beyond this point echoed increasing demand and primed the pump for potential gains to $0.28, the site of the last significant price hill.
Volume bars rose sharply to $49.31M on the breakout day, indicating a strong level of buyer interest.
The increase in volume was probably a genuine factor of interest in the breakout, indicating that the market participants were bullish so long as the trend at $0.2500 was in existence.
Polygon price prediction showed it could improve to $0.28 and maybe $0.30 if support cannot break down at $0.2633.
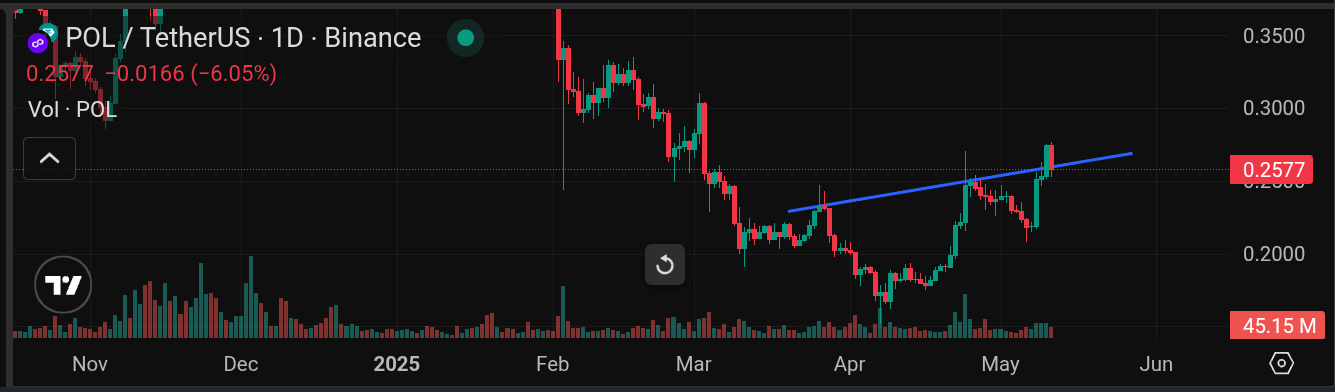
If such a move down to $0.2500 is to happen, it would perhaps indicate that the breakout was instead of genuine, and may trigger a drop back to $0.2200 and lower values.
The apparent formation looked like an ascending triangle with horizontal resistance at approximately $0.2500, increasing lows before a breakout.
Such a trend typically preceded an enduring increase, and reaching the $0.2633 level on the chart might indicate a moderate rise towards the $0.2800 level.
Polygon TVL at a $751M Low
Polygon’s TVL was just $751 Million, which was a rather significant drop from the levels that it once reached.
Such a decline highlighted changed risk perception by investors and called for a wider review of capital allocation practices in blockchain infrastructure.
Polygon’s TVL crossed the $10 Billion in the late months of 2021, the surge mainly due to the increased DeFi activity.
However, the rest of the funds left the ecosystem, and that translated into persistent losses, up until 2022 and 2023. The TVL went below $1 Billion and stabilized at $751 Million despite negligible variance.
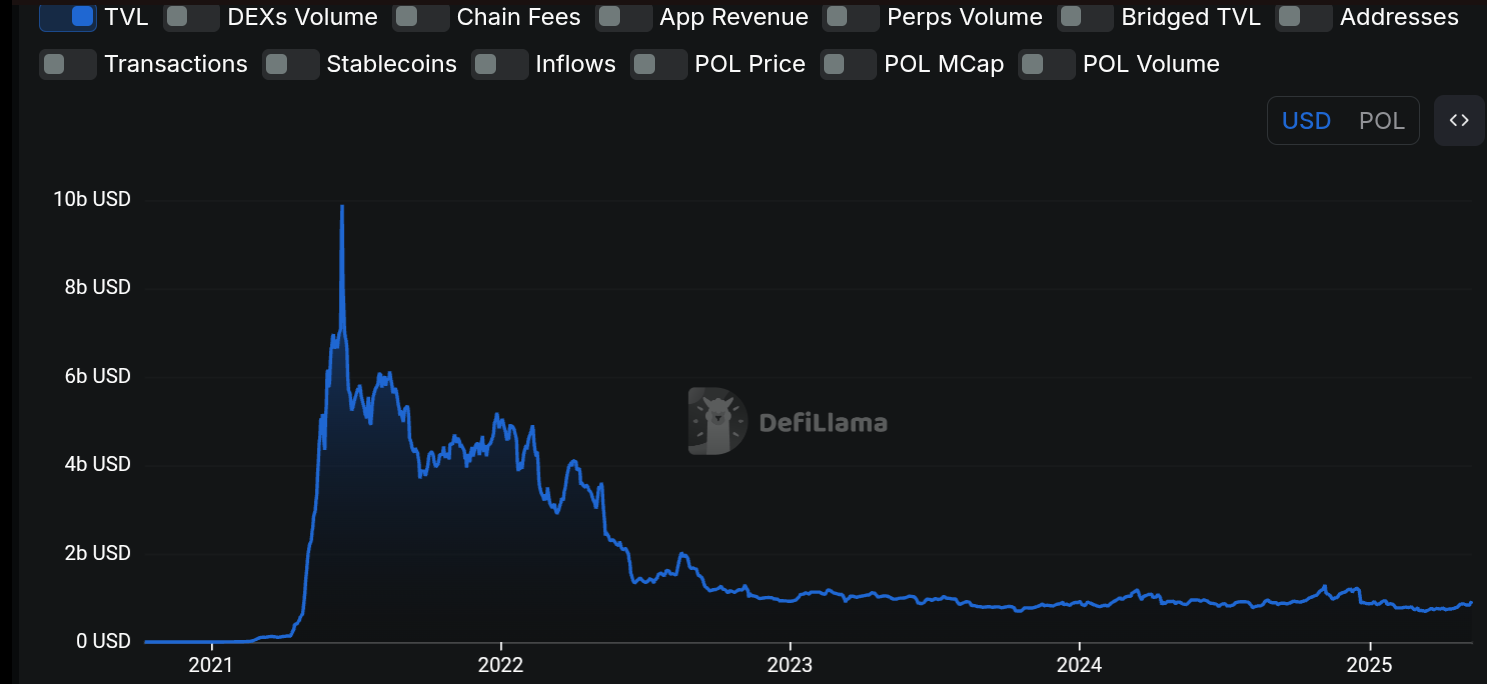
From this low, which was one of the lowest values since 2021, it might signal lesser liquidity participation and more conservatism on the part of the investors.
A prolonged period on the lowest of TVLs, under $800 Million, may indicate increasing doubt about the value.
On the flip side, consistent growth in TVL exceeding $1 Billion may indicate a reformation of market confidence and increased usage of the protocols.
Polygon Liquidation Heatmap
Polygon liquidation was accompanied by a neat uptick in the heatmap, indicating a clustering of leveraged trades over the $0.2500 to $0.2750 range.
Such an arrangement may indicate increasing volatility, with liquidation clusters perhaps causing sudden movements in price to the upside or the downside.
There was a concentration of liquidity, denser between $0.2650 and $0.2700, which most probably was fueled by increased trader participation.
These prices may entice quick fluctuations, which may lead to the liquidation of highly leveraged positions.
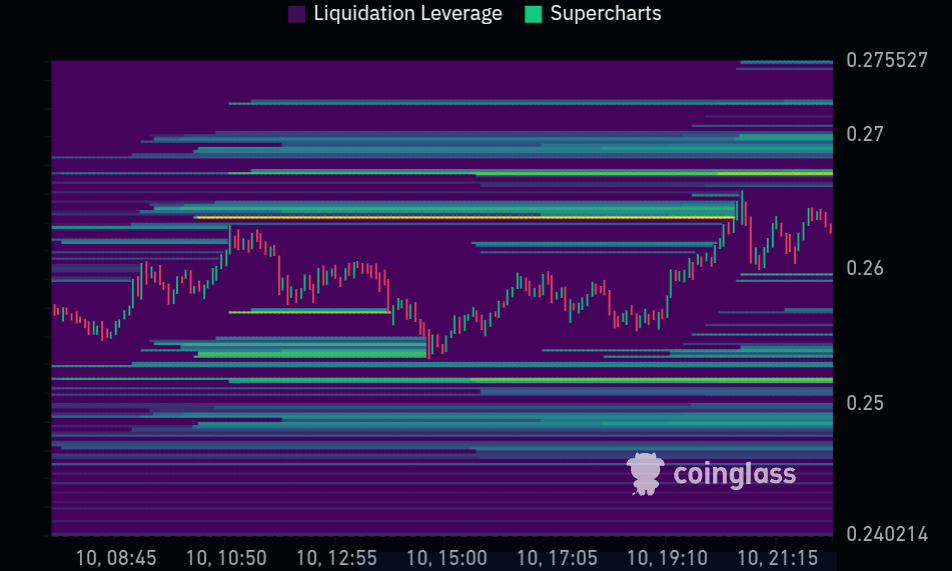
In the same vein, a considerable build-up just below $0.2550 suggested that any approach towards lower prices would trigger frantic plates that would further depress prices.
Should POL continue to climb above $0.27, a fresh spate in liquidations may send it towards $0.2755.
This indicated that traders were making bold positions; this could result in increased volatility. The overall trend could not be determined by the heatmap, but it identified critical levels at which price movement tendency could appear more pronounced.
Therefore, an increase in Polygon’s liquidation heatmap indicated a volatile trading market, where sharp movements away or toward these key zones may emerge.


