Polygon Price Prediction: Why The Downtrend Has Less Possibility Of A Rebound
Key Insights
- POL data showed over 90% of BTC addresses remained in profit, highlighting strong market resilience.
- POL indicators reflected subdued capital inflows, suggesting reduced investor enthusiasm despite positive net positioning.
- POL trends tracked increasing long-term BTC holdings, signaling growing confidence among experienced investors during consolidation.
Polygon (POL) price prediction suggested potential break from the wedge pattern which could lead to a move on either side.
Polygon Price Prediction
Polygon price followed a clear downward trend declining from its ATH near $2.90. The price chart showed a long-lasting triangle pattern with prices forming lower highs and a flat to slightly falling support line.
This pattern often pointed to continued downward movement. The price had touched the upper boundary of the triangle several times but failed to rise above it.
Most recently, it hovered just above the $0.17 mark, which showed a serious breakdown.
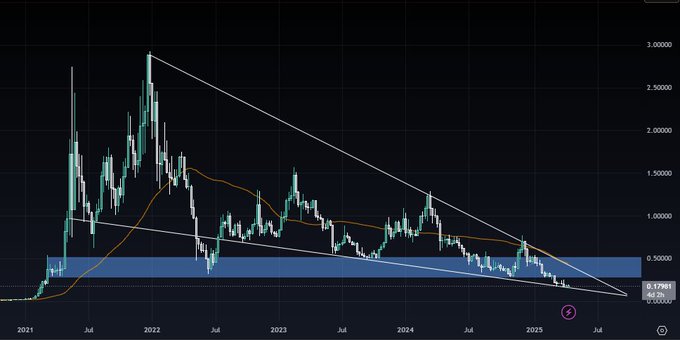
The previous support zone near $0.28 had helped the price stay stable through 2023 and early 2024. However, the price broke below it, which showed weakness and suggested that negative sentiment might continue.
This $0.28 level might now act as resistance if the price tried to rise again.
The 200-day moving average, which was trending downward, had acted as resistance during the decline and stayed far above the current price.
Since the price was still below both the triangle pattern and the moving average, POL might continue to fall and possibly revisit the $0.15 level or lower.
Still, a price recovery might happen if it rose above $0.28 and stayed above the trendline near $0.45. Until that happened, the overall market structure stayed negative, with weak momentum and little sign of a rebound.
POL Market Sentiment
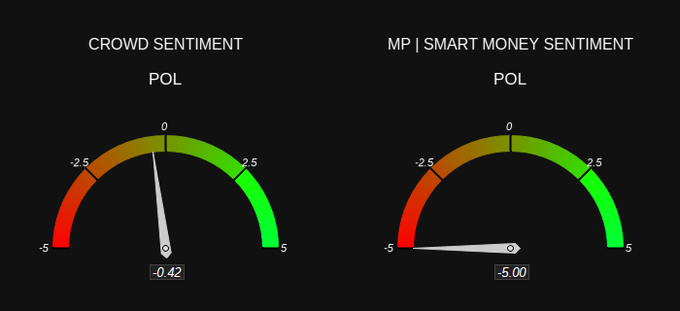
Market sentiment data showed strong negative pressure . Crowd sentiment sat slightly below zero at -0.42, which meant that everyday investors were only mildly negative.
On the other hand, smart money sentiment hit -5.00, the lowest possible reading.
This large difference showed that while retail traders still hoped for a recovery, big investors had completely lost confidence.
This sentiment matched the price falling below the key $0.28 level and sitting near $0.17, a level not seen since early 2021.
Based on the mood, any price increase might face resistance at $0.28. A move toward the trendline near $0.45 might only happen if there was a strong shift in buying. The triangle pattern supported this view.
However, if investor sentiment—especially from smart money—improved, POL might reclaim $0.28 and begin to change direction. Until then, the indicators suggested that the price would most likely keep falling.
Long/Short Ratio Analysis Show Indecision and Pressure from Sellers
The POL long/short ratio chart showed a market full of uncertainty. In recent trading sessions, the ratio moved between 0.80 and 1.30, showing that traders could not agree on a clear direction.
At times, long (buy) positions briefly overtook short (sell) ones, rising above 1.20, but these moments were short-lived. This suggested that buyers did not have lasting confidence.
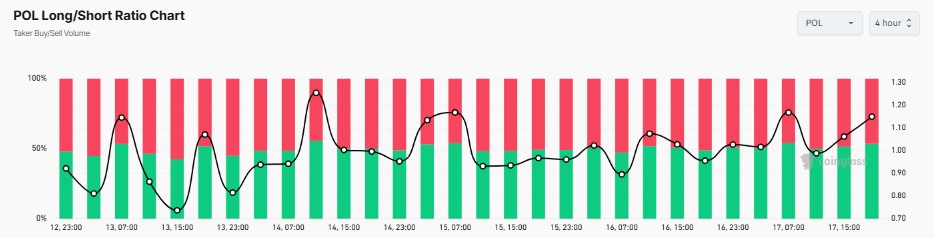
A pattern appeared where the ratio approached 1.25, but short-selling soon took over. This caused the ratio to drop back toward 1.00, showing that sellers continued to overpower buyers.
Between the 13th and 17th, red bars (representing more selling volume) became more common, which confirmed strong downward pressure.
If the ratio had stayed above 1.20, it might have hinted at a possible bounce back to $0.28. But if it dropped again and stayed near 0.90, the price might remain stuck below $0.20 and even fall back to around $0.17.
The current pattern showed a market struggle, but sellers still seemed to have control.


