

Key Insights:
- SHIB held above $0.013268, with $0.013522 as immediate resistance and $0.013154 as key support during short-term consolidation.
- SHIB witnessed aggressive volatility, where spikes in open interest without matching volume often preceded sharp corrections around $0.00001 levels.
- SHIB faced persistent outflows, especially the -$50M dip in November, suggesting dominant bearish sentiment and weak accumulation signals.
Analysis of the hourly chart for Shiba Inu (SHIB) price prediction reflected a short-term consolidation phase, following a recovery from the swing low at $0.000012787.
SHIB Price Prediction
SHIB price hovered near $0.000013464, maintaining position above the 0.5 Fibonacci retracement level at $0.000013268, which served as a critical midpoint buffer after the rebound.
The Fibonacci retracement levels spanned from $0.000012787 low to $0.000013750 high, with the 0.236 level at $0.000013522 acting as immediate resistance and the 0.618 level at $0.000013154 serving as essential support.
A breakout above $0.000013522 could open a path to retest the local high at $0.000013750, particularly if supported by rising volume and bullish momentum.
However, if the price failed to stay above $0.000013268, it might invite renewed selling pressure, potentially dragging it down to $0.013154, or even to the 0.786 retracement at $0.012993. A decisive drop below this could lead to a retest of $0.012787.
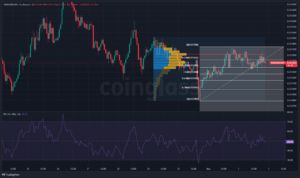
The RSI stood at 48.93, indicating neutral momentum. While a rise above 50 might support a bullish continuation, a drop below 45 could align with a renewed bearish trend.
Moreover, the visible volume profile highlighted a high-activity node between $0.000013300 and $0.000013400, suggesting this zone functioned as a fair value area.
Sustaining above this range could favor bulls, whereas slipping below might allow bears to take control.
Although no strong continuation pattern was present, the horizontal consolidation signaled market indecision, which might soon resolve into a sharp directional move.
Cyclical Volatility: The Role of Open Interest and Volume
SHIB’s price action, open interest, and volume highlighted recurring cycles of volatility that might shape trader behavior.
A major surge when SHIB’s price spiked was driven by sharp increases in both volume and open interest—suggesting aggressive long positioning and heightened bullish sentiment.
However, this was quickly followed by a sharp drop back accompanied by declines in both indicators, possibly pointing to the unwinding of leveraged positions or panic selling.
Smaller peaks in open interest during late December and early March coincided with brief rallies toward $0.000015, yet these lacked consistent volume support.
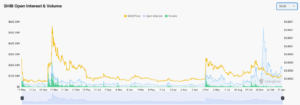
This divergence might have implied weak buyer conviction and an increased risk of price rejection.
If SHIB had broken above $0.00001 with renewed volume and rising open interest, bullish momentum might strengthened. Conversely, a failure to hold above $0.000008 could reinforce bearish control.
The repeating pattern of retracements following spikes in open interest suggested speculative exhaustion.
Going forward, SHIB might remain vulnerable to sudden corrections if open interest increased without corresponding volume strength.
Netflow Trends: Distribution Dominates, Accumulation Lags
SHIB’s Netflow activity consistently dominated by outflows, is signaling sustained distribution and potential bearish undertones.
The most pronounced outflow occurred in mid-November, totaling nearly -$50 million, while SHIB’s price lingered near $0.000008.
This substantial withdrawal might have reflected widespread exits driven by profit-taking or fear-driven selloffs reinforcing the downtrend, especially as multiple bars emerged consecutively.
Positive net-flows were less common and relatively smaller, with notable inflows in early September and late December.
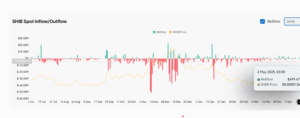
These coincided with temporary price rebound, yet the lack of extended inflow strength suggested shallow accumulation interest.
SHIB saw a modest inflow of $499.47K, while the price stood at $0.00001344, which might have hinted at neutral sentiment or the beginning of quiet accumulation.
If netflows turned consistently positive, SHIB’s price might rise. However, further outflows exceeding could pushed the price back down.
This pattern revealed a cautious market, where any sudden netflow imbalance might determine the near-term direction.


