

Key Insights:
- If momentum continued, SHIB broke the structure above $0.00001200, indicating bullish strength with eyes on $0.00001300.
- SHIB faced heavy liquidation pressure near $0.00001260, suggesting a potential short squeeze or sharp rejection.
- SHIB hovered around $0.00001203. Absorption or failure might determine whether the price climbs toward $0.00001236 or dips to $0.00001174.
Shiba Inu (SHIB) showed signs of shifting from bearish to bullish on lower timeframes. However, an explicit confirmation of this trend was still pending, making Shiba price prediction a key focus for traders.
Shiba Price Prediction
SHIB shows early signs of a potential bullish recovery, trading at $0.00001232, up 2.24% at this 4-hour chart reading. Recent demand from buyers pushed through the $0.00001200 resistance. This allowed for a Break in the Structure.
This could lead SHIB to challenge the next significant level, $0.00001300. The upward momentum of SHIB at $0.00001232 failed to sustain. The coin could not reach the next resistance level at $0.00001300, which functioned as a previous distribution area.
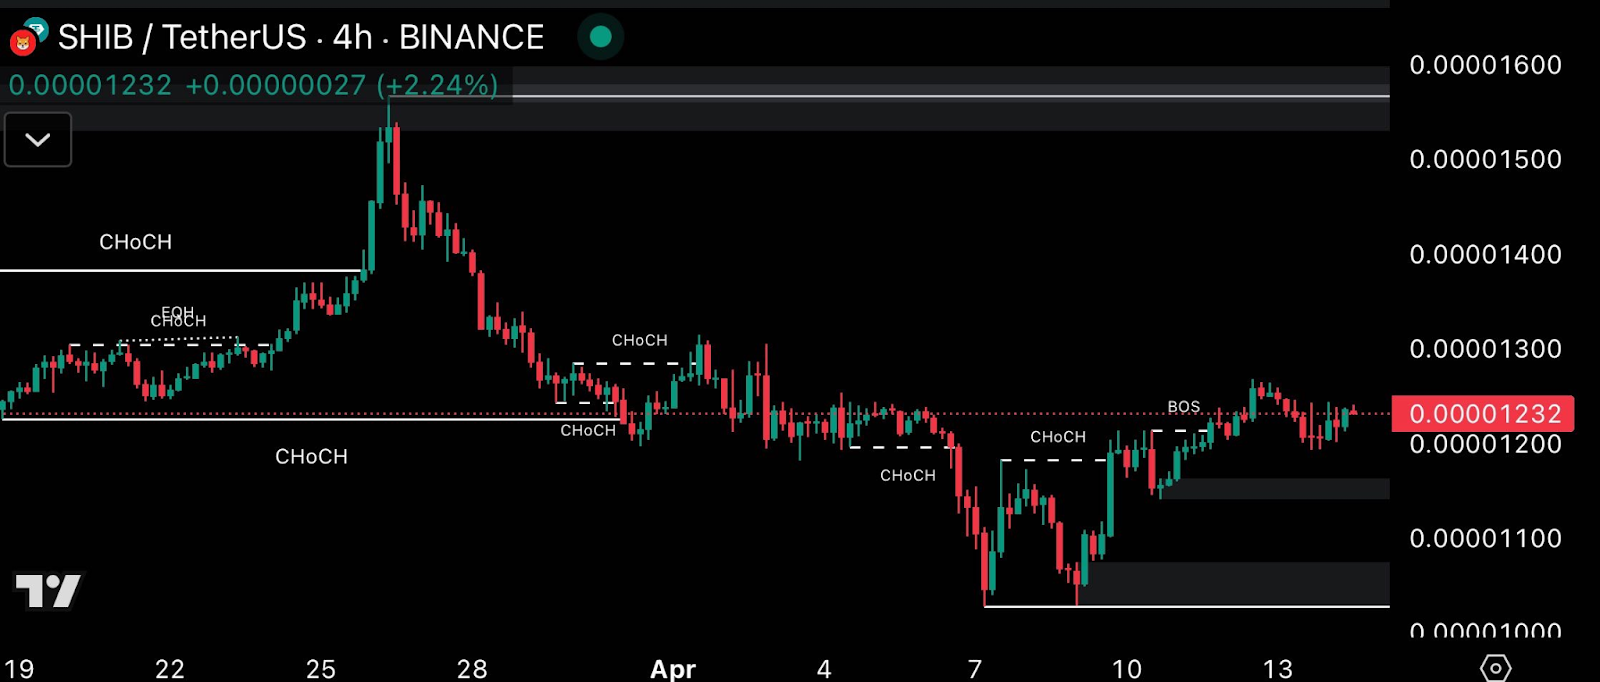
Further analyses indicated numerous Change of Character patterns that emerged earlier on the chart. This highlighted an uncertain and volatile market situation.
Before the BOS point, the Change of Character pattern marked an essential transition from bearish to bullish market atmosphere. At the same time, it was set just below $0.00001200.
SHIB would have likely retraced to examine demand areas at $0.00001100 and $0.00001050. However, it did not reach these levels due to successfully maintaining support above $0.00001232.
Current CHoCH occurrence showed the potential for either intense market progress or rapid market swings.
Also, the previous price reversal point occurred at $0.00001450. Thus, resistance might have intensified between the ranges $0.00001400 to $0.00001500 if bulls had managed to surpass $0.00001300.
Liquidity Clusters Signal Key Battle Zones
Consequently, during the last 24-hour period, SHIB traded between $0.00001200 and $0.00001260. The liquidation heatmap data showed thick clusters in the $0.00001260 area.
The significant liquidity node at $0.00001260 stood as a vital point. This is because its reset could initiate multiple stop-loss events that triggered an upward push toward $0.00001289.
SHIB could have returned to the lower price region of $0.00001200. It could also be dropped to $0.00001170 if the barrier at $0.00001260 failed to break.
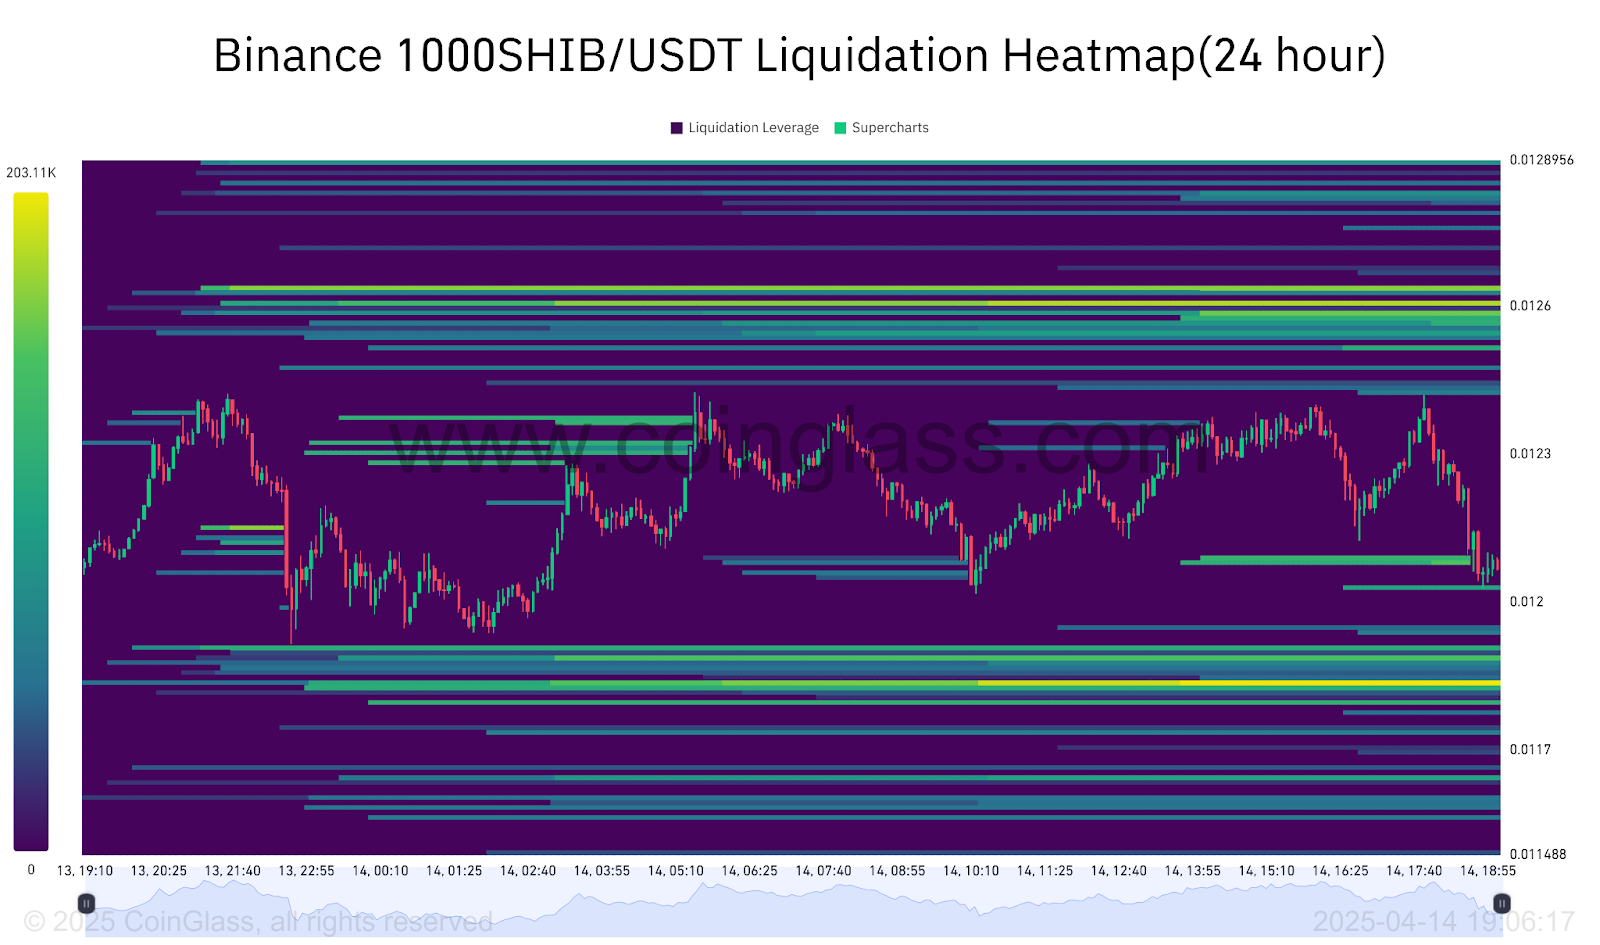
At $0.00001260, a high level of liquidation interest exposed weaknesses in short positions. This made the price level an attractive target for liquidity manipulation.
The visible buildup of liquidation interest at $0.00001260 suggested that many short positions were at risk. This made it an attractive target for liquidity grabs.
Meanwhile, lighter liquidation pockets around $0.00001200 and $0.00001170 indicated potential support zones. A breakdown below $0.00001200 could have exposed SHIB to further downside, with $0.00001150 as the next possible target.
Market participants showed continued interest at around $0.00001200 because the superchart indicator confirmed it. The potential bullish movement remained limited because a verified breakout above $0.00001260 did not occur.
The cryptocurrency price movement of SHIB would reach $0.00001289 through upward momentum. However, it could also return to the lower support level at $0.00001170.
Liquidation Maps Show Structural Compression
Moreover, the SHIB spot inflow/outflow revealed significant patterns in netflow and Shiba price prediction movements. The netflow fluctuated between $30.00M inflows and -$50.00M outflows, while the SHIB price hovered around $0.0000.
Early in the period, around June 26, a sharp $20.00M inflow coincided with a slight price uptick to $0.0000. This suggested potential buying pressure. Conversely, a massive -50.00M outflow might have driven the price down, reflecting heavy selling.
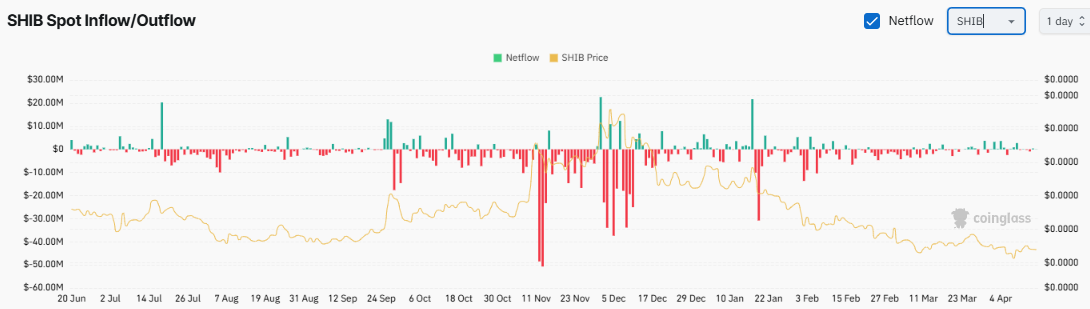
Recurring outflow spikes, like the -$30.00M on October 6, often preceded price dips, indicating bearish sentiment. However, inflows around December 17 at $10.00M could have signaled accumulation, potentially stabilizing the price at $0.0000.
Gained outflows above -$40.00M might push the price lower, while inflows nearing $20.00M could lift it. Smaller outflows below -$10.00M or consistent inflows could have helped support price recovery. However, persistent negative netflow might have led to deeper declines.


