Shiba Inu Price Prediction: SHIB Targets $0.000081; Analysts Predict 503% Price Surge
- Shiba inu price forms a textbook Inverse Head & Shoulders pattern, signaling a potential breakout above $0.00001500.
- Over $72K in short liquidations in 24h indicates bullish pressure and weakening bearish momentum in SHIB.
- Analysts set the SHIB price target at $0.000081, forecasting a possible 503% surge from current levels.
The Shiba Inu price is gaining attention as market analysts suggest a potential surge of up to 503%. Recent price action shows the formation of a bullish chart pattern, raising expectations of a breakout.
With rising volume, increasing open interest, and a favorable technical setup, SHIB may be preparing for a significant move upward. Traders are closely watching key levels that could trigger the next rally.
Bullish Pattern Points to Breakout Potential
Shiba Inu has recently formed a classic “Inverse Head and Shoulders” (IH&S) pattern on the weekly chart. This structure usually forms after long periods of downward pressure.
It often marks a reversal from a bearish phase to an upward trend. Analysts see the neckline of this pattern at approximately $0.00001500, which is a key resistance level.
The left shoulder was shaped during mid-2022, followed by the head at the lowest point between late 2022 and early 2023. The right shoulder developed through 2023 and into 2024. The structure is symmetrical, and the price has now approached the neckline.
A close above this resistance with substantial trading volume could confirm the breakout. If this happens, price projections estimate a target between $0.00002400 and $0.00003000, based on the height of the pattern.
Volume has also supported the pattern. Analysts point to declining volume during the head’s formation and increasing volume during the recent upward movements.
This aligns with historical behavior seen in similar bullish chart formations. The breakout confirmation will depend on sustained price action and an apparent increase in volume around the neckline.
Short Liquidations Indicate Weakening Bearish Sentiment
Over the last 24 hours, the market has seen large short liquidations, totaling $72,500. This comes after similar patterns in the 12-hour and 4-hour timeframes.
The 12-hour data shows $65,640 in short positions being closed, while the 4-hour window had $23,730 in short liquidations.
These events suggest that bearish traders are being forced to exit, which is often a sign of a potential trend reversal.
The increase in long positions on exchanges such as OKX also supports this view. The long/short ratio on OKX stands at 2.3, showing more traders betting on higher prices.
On the other hand, the average long/short ratio across platforms is 0.9794, indicating a market that is still cautious.
This mixed sentiment could lead to higher volatility but also suggests room for growth if more traders shift to the long side.
Open interest has risen by 3.81% to $162.74 million, with volume up by 15.25% to $133.20 million. These increases are viewed as signs of growing participation and capital entering the SHIB market.
When combined with price increases, rising volume and open interest often support the potential for a sustained rally.
Shiba Inu Price Technical Indicators Suggest Positive Momentum
At press time, SHIB stood at $0.00001298, showing a 1.67% decrease over the last 24 hours. MACD (Moving Average Convergence Divergence) line has crossed above the signal line.
This indicates growing buying pressure and a potential shift from a bearish to bullish trend. The histogram bars turning green also support the presence of upward momentum.
Meanwhile, the Relative Strength Index (RSI) was at 40.2, back in the oversold territory. If RSI continues to rise and crosses 60, it may signal further strength in the price movement.
The Fibonacci retracement level at 0.00001489, marking the 38.2% zone, is being watched closely. It acts as a strong resistance level that must be broken for upward momentum to continue.
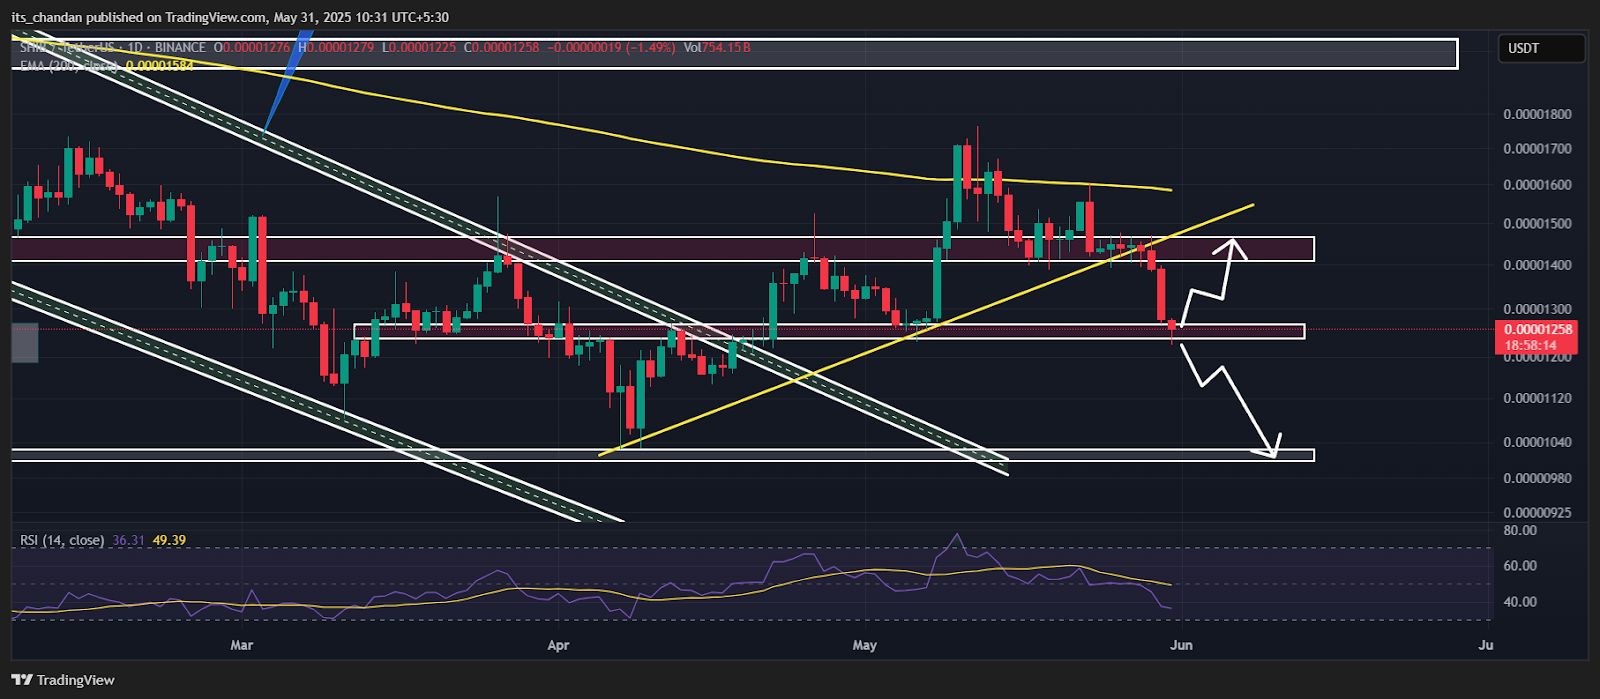
Shiba Inu also shows a slight bounce from the $0.00001200 support zone. This recent rebound indicates the presence of demand at lower price levels.
Traders expect higher price activity if SHIB breaks above the $0.00001350 resistance level, which has acted as a congestion zone in the past.
Supply Metrics and Market Structure
The total supply of Shiba Inu right now is about 4.76 trillion tokens. Most of the one quadrillion tokens created at the start have been destroyed.
Token burn has gone up to 139.95%, suggesting more work is being done to reduce the supply of tokens.
In spite of former drops in inflation, the structure is reforming. Prices moved lower until a recent recovery from around $0.00001200.
At $0.00001298, it still above the latest support. For SHIB to show a trend reversal, it has to climb to higher peaks and overcome primary resistance levels step by step.
While writing, volume was moderate; price could rise faster above the $0.00001350 with more activity. Traders usually wait for the price to cross $0.00001500 before putting on more long trades.
Analysts are tracking these levels to see if SHIB is starting a new stage. Should volume and structure cooperate, a 503% price increase to $0.000081 is expected, multiple analysts believe.