Solana News: SOL Price Holds Support As Bulls Eye Rally To $200

- Solana price must stay above $143.94 to maintain its bullish Elliott Wave setup.
- A breakout above $200 could trigger a rapid rally toward the $220–$250 zone.
- Analysts suggest that strong volume supports current upward momentum, but confirmation is key.
After moving up to $250, Solana price was testing support at $151, while writing. According to technical analysts, a bounce-back in SOL price might start at this stage, as investors could target $200 and $250 as the next positions to watch.
Here, the analysis is based on the Elliott Wave counts, Fibonacci points, and volume movements behind the latest Solana news.
Solana News: Resistance at $200 Remains Key Level
Analyst @WHALES_CRYPTOzz identified the $200 mark as a major barrier for Solana price. Additionally, SOL price had reached this place and failed to go above, as indicated in the chart.
The crypto analyst noted that the $200 price band matches old resistance highs and has prevented the bulls from overcoming it for several months in a row.
The latest Solana news indicated that SOL price had moved within a parallel channel and just got back to the channel’s upper boundary during the latest bullish movement.
Solana price went up in a steep rise starting from $156, with the 100-day moving average still indicating that the upward trend is intact.
The top altcoin hitting above $200 on the chart would be an important sign for Solana news. Going by the chart’s predictions, the new price direction could steer the price range between $220 and $250.
Elliott Wave Count Signals Upside Structure
Furthermore, More Crypto Online’s 1-hour chart applies Elliott Wave Theory to Solana crypto, presenting a wave count currently in development. The analyst marks the recent low as the conclusion of wave (2), followed by a partial rally that could represent wave (1) of a new bullish cycle.
The ongoing pullback is now resting near the 38.2% Fibonacci retracement level at $148.25, which still constitutes a shallow correction.
Key Fibonacci supports lie further below at $146.98 (50%), $145.72 (61.8%), and $143.94 (78.6%). According to the analysis, the bullish wave setup remains intact as long as SOL price stays above $143.94. A break below this level would invalidate the impulsive structure and shift expectations further downside.
Additionally, the wave count anticipates potential development of a larger wave (3), which could propel Solana price toward $159–$180. However, this remains unconfirmed without stronger impulse behaviour and volume participation.
Analyst Eyes Strong Rebound from $151 Support Zone
Analyst @Nizzan_GTR 4-hour chart showed Solana coin testing a key support zone at $151, following a notable pullback from its recent peak above $250.
The analyst highlights this area as a prior structural high that previously served as a resistance level, now turned into support.
SOL price is now consolidating in this zone, with declining volume suggesting reduced selling pressure.
Besides, the chart also references the POE (Point of Entry) zone at around $100, from which Solana price began a strong upward move earlier in the year. That rally confirms the point as a high-demand accumulation level.
However, with the current pullback respecting this broader bullish structure, the analyst interprets the move as corrective rather than a full reversal. If the $151 level holds, a bounce back toward the $180–$200 zone is anticipated according to the latest Solana news.
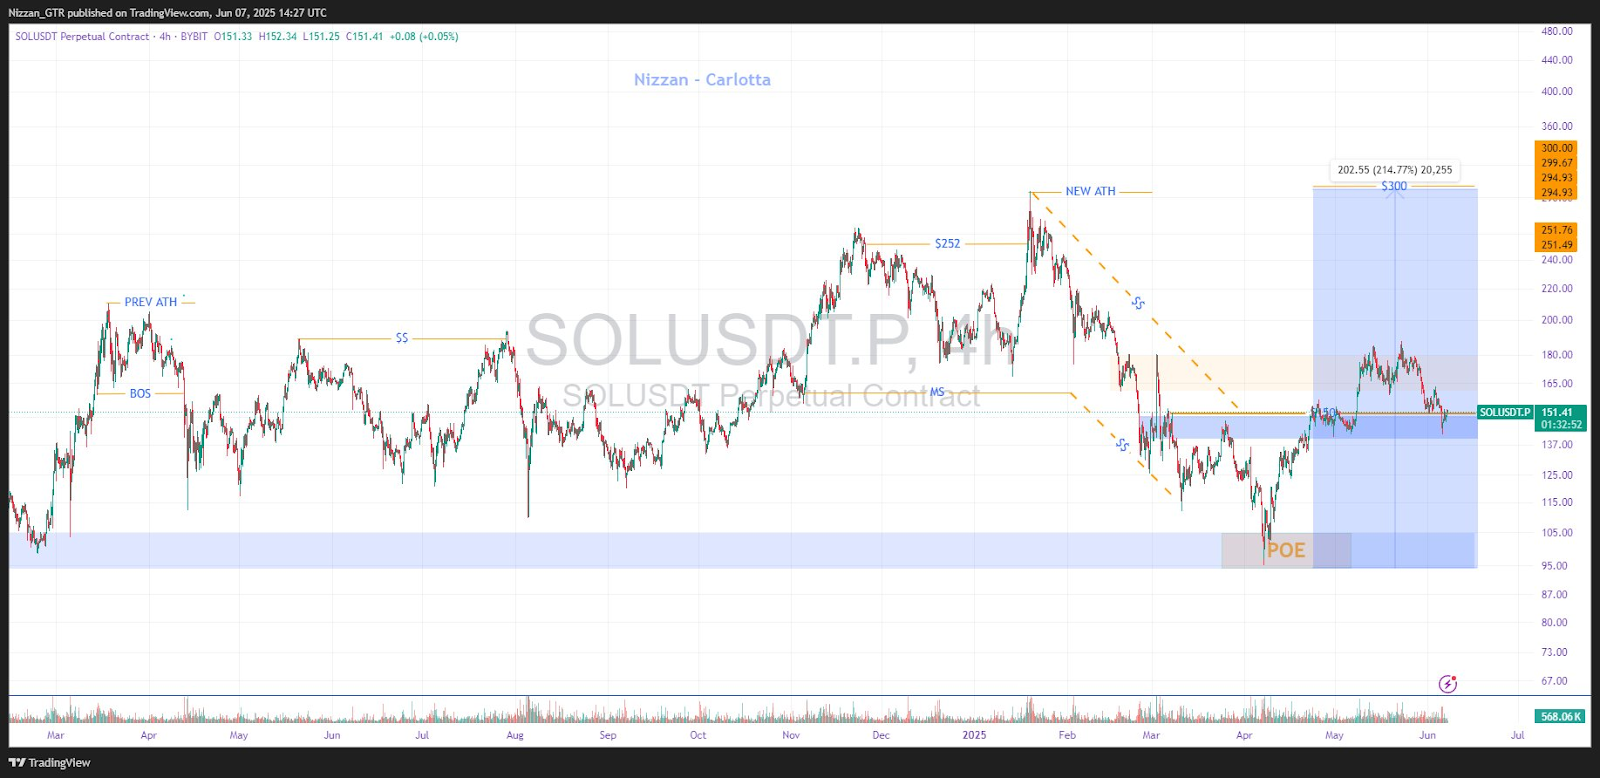
Shaping up Solana news, upside projections from this chart stretch as far as SOL price at $300, marking a 214% potential gain from the POE region. This target aligns with historical highs and previous range expansions.
However, should Solana price fall decisively below $151, the chart points to a possible shift in trend and a deeper retracement.


