Solana Price Preparing For A Parabolic Move To $200 In The Next Rally?
Key Insights
- A whale moved 11,445 SOL to Binance, signaling possible increased trading activity or liquidity shifts.
- Solana’s 4-hour chart shows a bearish rising wedge and resistance near $184, hinting at short-term pressure.
- Despite bearish signals, 76.1% of SOL holders are in profit and daily active addresses hit 6 million.
Solana (SOL) has recently caught the attention of traders and investors as it experiences notable price movements. A large whale has unstaked and deposited 11,445 SOL worth over $2 million into Binance. This comes amid mixed technical signals and strong on-chain data.
While some charts show bearish trends, other metrics suggest a possible buildup for a strong upward move. The question remains whether Solana is setting the stage for a parabolic rally toward $200 in the near future.
Solana Showing Massive Whale Activity and Its Market Impact
The recent unstaking activity by a whale, moving 11,445 SOL back into Binance, marks a significant event in Solana’s ecosystem.
This whale had previously staked 30,000 SOL through JitoSOL, a liquid staking platform, and still holds 18,290 JitoSOL tokens valued at nearly $3.9 million.
The transfer of such a large amount to an exchange could suggest preparing for trading or liquidity events.
Large holders, or whales, influence market sentiment and price action. When whales move tokens to exchanges, it can lead to increased selling pressure.
However, this transfer could also signal positioning for a future rally, depending on market conditions. Traders closely watch these movements for clues on Solana’s short-term trend.
On-chain data also shows strong investor activity. Around 76.1% of SOL’s circulating supply is currently in profit, which points to widespread gains.
Additionally, daily active addresses on Solana have reached 6 million, indicating healthy network usage. These factors contribute to a positive fundamental outlook despite short-term price fluctuations.
Technical Chart Patterns Suggest Mixed Signals
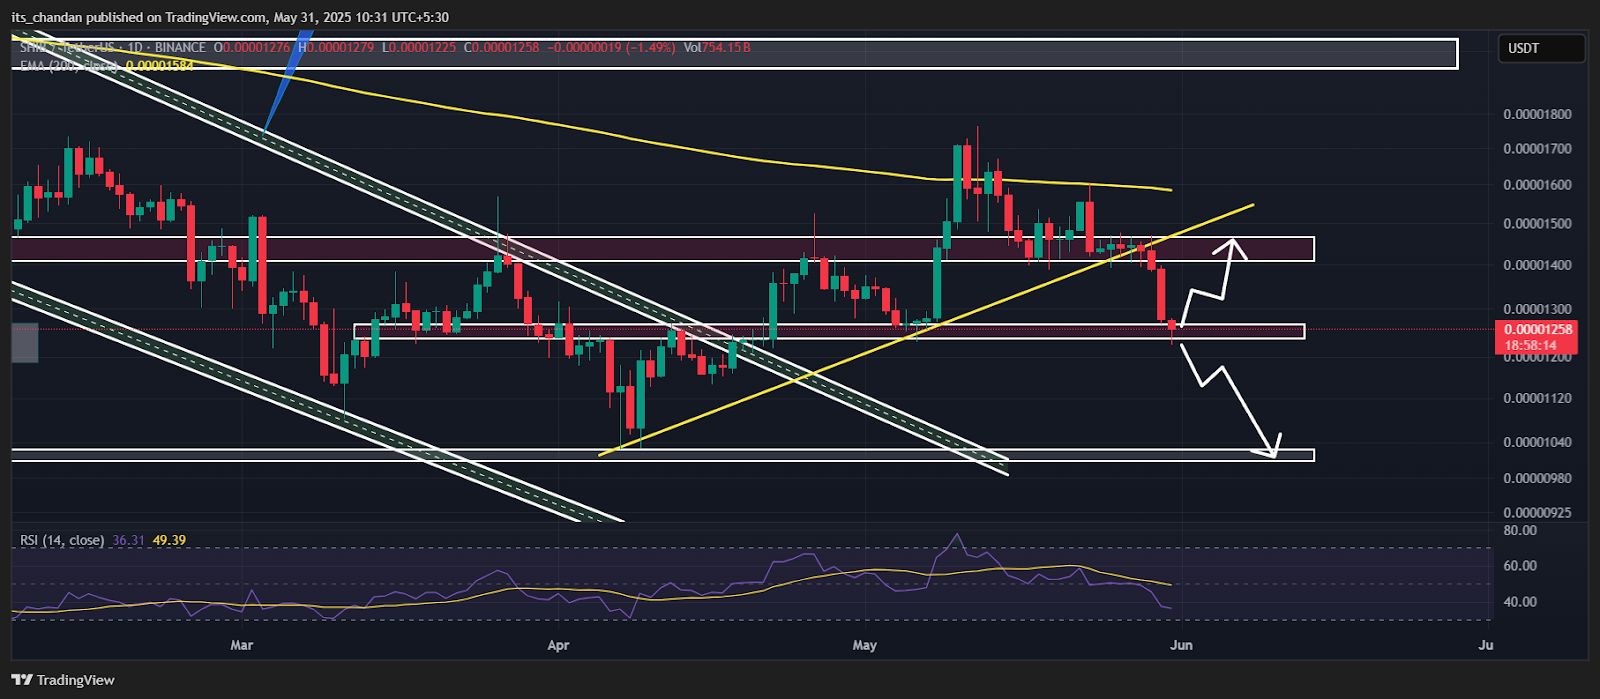
Solana’s price charts reveal a complex technical picture. On the 4-hour chart, a bearish “rising wedge” pattern has formed, which usually predicts downward price pressure.
The asset also faces resistance near the $183 to $184 zone, where a potential double top pattern is visible. Both formations generally warn of possible price corrections.
The stochastic oscillator reading above 86 further indicates that SOL is currently overbought. Overbought conditions often lead to short-term price drops as traders take profits. If the price breaks below recent support levels, it could decline toward $161, a previous area of buying interest.
On the other hand, the RSI (Relative Strength Index) is near oversold levels on some shorter timeframes, suggesting selling pressure may ease soon.
The MACD (Moving Average Convergence Divergence) shows bearish momentum with the MACD line below the signal line. These mixed technical signals create uncertainty about Solana’s immediate direction.
Market Sentiment and Futures Activity showing Indecision on Solana
Solana is being looked at cautiously by most investors. More traders expect prices to go down shortly which explains the -0.0002% funding rate on futures. As Glassnote’s recent data shows, Solana is the only major non-stablecoin cryptocurrency bucking the trend. It appears traders are getting ready for the market to correct or hold steady.
A large number of traders are still active in Solana futures, as $4.5 billion in open interest is seen. When open interest and negative funding rates rise, it’s usually a sign that traders are shorting the market. They can bring a lot of risk since traders adjust their decisions according to sudden price movements.
Despite these difficulties, investors continue to own their positions because on-chain data still looks encouraging. When the direction of the bearish patterns becomes clear, the market could see a large move because its fundamentals are strong.
Solana is hit by temporary difficulties, but signs show it could be about to start a strong rally. More whale trading, solid evidence, and active volume suggest that more investors are paying attention. If SOL manages to rise above the $184 limit, it could push the price of SOL higher quickly.
Reaching resistance could boost Solana all the way to the $200 mark, since many traders view this price as significant.
Many traders notice these important numbers since they sometimes lead to increased buying. A price hike to $200 would be a significant step up from where Bitcoin is now, around $166.
The way the rising wedge and double top patterns are drawn will play a vital role in your trading. Should the downward trends not result in a long decline, buyers may push Solana’s price into a parabolic move. This means that the market must be positive and active over some time.


