
Key Insights:
- Stellar (XLM) is poised to end its bearish streak as the daily chart flashes a bullish divergence.
- XLM price prediction suggests that the coin still has the potential to soar 10% in the coming days.
- The $0.2678 level appears to be a make-or-break point for the asset.
Stellar price prediction appears bullish, as its price action flashes a bullish signal and hints at strong upside momentum. This bullish outlook emerges on the four-hour chart following continuous price declines in recent days.
Market Sentiment & Current Stellar Price Momentum
The overall cryptocurrency market seems to be struggling to gain momentum, and so is the Stellar price. At press time, XLM was trading near $0.2715, having registered a modest price decline of 0.50% over the past 24 hours.
Amid this market uncertainty, the fall in asset prices has caused fear among traders and investors, leading to lower participation. Data from CoinMarketCap revealed that XLM’s trading volume during the same period dropped by 35% compared to the previous day.
On-Chain Metrics Show Mixed Sentiment
Some appear to be taking advantage of the asset’s lower price. In contrast, others are either dumping or making bearish bets to capitalize on the downside opportunity, according to Coinglass.
Data from spot inflow/outflow reveals that exchanges have witnessed an outflow of XLM coins over the past 24 hours. According to the data, they have recorded a modest outflow of $555K worth of XLM coins.
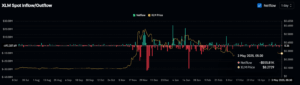
This asset outflow is bullish, indicating that investors and long-term holders may be accumulating the tokens. On the other hand, traders are following the current market sentiment.
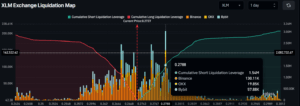
Traders are over-leveraged, with support at $0.2653. Resistance is at $0.2788, according to on-chain metrics.
These levels have attracted $1.13 Million worth of long positions and $1.54 Million worth of short positions. This indicates that bears are currently dominating and appear to be pushing the Stellar price lower.
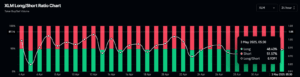
XLM Long/Short ratio further confirmed traders’ bearish outlook. It currently stands at 0.93 at press time, indicating strong bearish sentiment among market participants.
48.43% of traders are in long positions, while 51.57% are in short positions. This imbalance explains the higher position value on the short side.
When combining these on-chain metrics, the short-term market trend appears to be bearish, while the long-term outlook remains bullish.
Stellar Price Action & Key Levels
According to expert technical analysis, the Stellar price prediction appears bullish due to its positive price action pattern. The four-hour chart reveals that the asset faces resistance from a descending trendline and is on the verge of a breakout.
The chart reveals a bullish divergence, signaling strong momentum. This suggests the price is likely to continue rising.
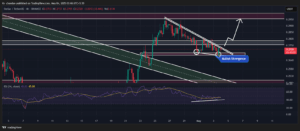
On the four-hour chart, Stellar price has formed a bullish engulfing candlestick pattern at the $0.267 support level. This was followed by a bullish hammer, reinforcing upward momentum.
Suppose this momentum continues and the price breaches the trendline, closing a four-hour candle above the $0.2740 level. In that case, the Stellar price prediction turns bullish and could see 10% upside momentum, potentially reaching the $0.30 level.
If XLM fails to hold the $0.267 support level and closes a four-hour candle below it, the price prediction may turn bearish. This would signal potential downside movement.


