

SUI Coin Price Flashes Bullish Signal, Bull Run Incoming?
- The daily chart reveals that the SUI coin price is poised for a 25% upside rally.
- SUI’s open interest (OI) soared by 15%, indicating heightened participation from traders.
- Exchanges recorded the highest inflow of $16.65 million worth of SUI since February 2025.
SUI coin has been garnering significant attention from crypto enthusiasts due to its impressive performance. On April 24, 2025, while major cryptocurrencies, including Bitcoin (BTC), Ethereum (ETH), and Solana (SOL), struggled to gain momentum, SUI led the crypto market with a 13% upside rally.
This notable jump in the SUI coin price appears to have shifted the prolonged bearish trend into a bullish one.
Current Price Momentum
At press time, SUI was trading near $3.23 and had recorded a price surge of 13% over the past 24 hours. However, during the same period, its trading volume dropped by 5%, indicating lower participation from traders and investors compared to the previous day.
SUI Coin Price Action and Technical Analysis
According to expert technical analysis, SUI appears bullish and is poised to continue its upward momentum due to the shift in market sentiment.
As per the daily chart, over the past three trading days, the SUI coin price has broken out from two major resistance levels of $2.50 and $2.87 and is now heading toward the third resistance level.
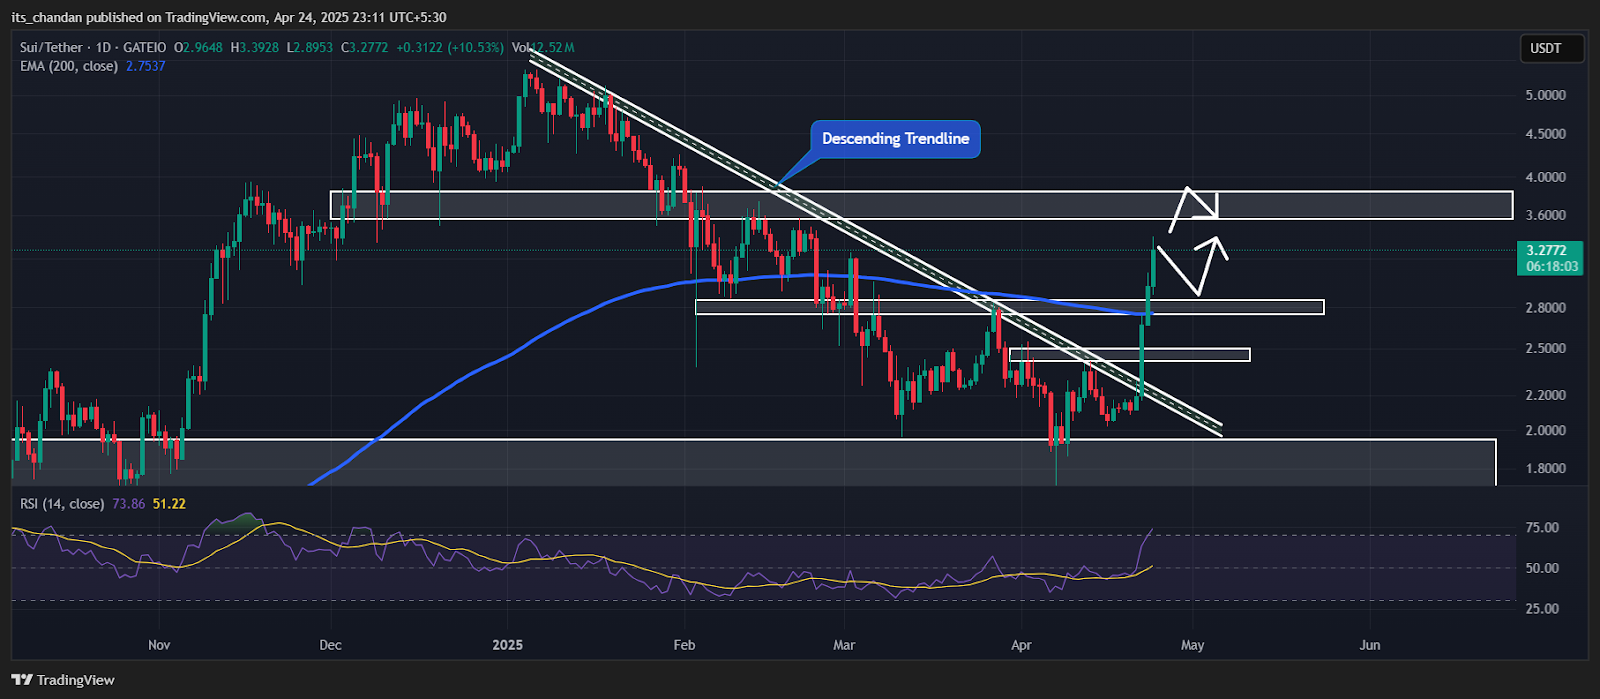
SUIUSDT Daily Chart | Source: Trading View
SUI Coin Price Prediction
Based on the daily chart, if this upward momentum continues and the SUI coin price manages to hold above the $2.90 level, it could soar by another 17% until it reaches the $3.85 mark in the coming days. Conversely, the SUI coin price prediction could turn bearish only if the coin enters a correction phase and falls below the $2.75 mark.
With the notable price surge, the SUI coin price is now moving above the 200-day Exponential Moving Average (EMA) on the daily timeframe, indicating that the asset is in an uptrend and holds strong bullish momentum.
Traders and investors primarily use the 200 EMA to determine whether an asset is in an uptrend or a downtrend, and they make informed decisions based on that.
Meanwhile, SUI’s Relative Strength Index (RSI) stands at 74, indicating strong bullish momentum for the asset. However, as it is in the overbought zone, there is also a possibility of a short-term price correction before the SUI coin experiences a major upside rally.
Mixed Sentiment From On-Chain Metrics
While examining the on-chain metrics, it appears that traders and investors have differing outlooks, as reported by the on-chain analytics firm Coinglass.
$16.64 Million Worth of SUI Inflow
Data from the spot inflow/outflow reveals that exchanges have witnessed an inflow of a significant $16.64 million worth of SUI tokens in the past 24 hours, indicating potential dumps by investors and long-term holders.
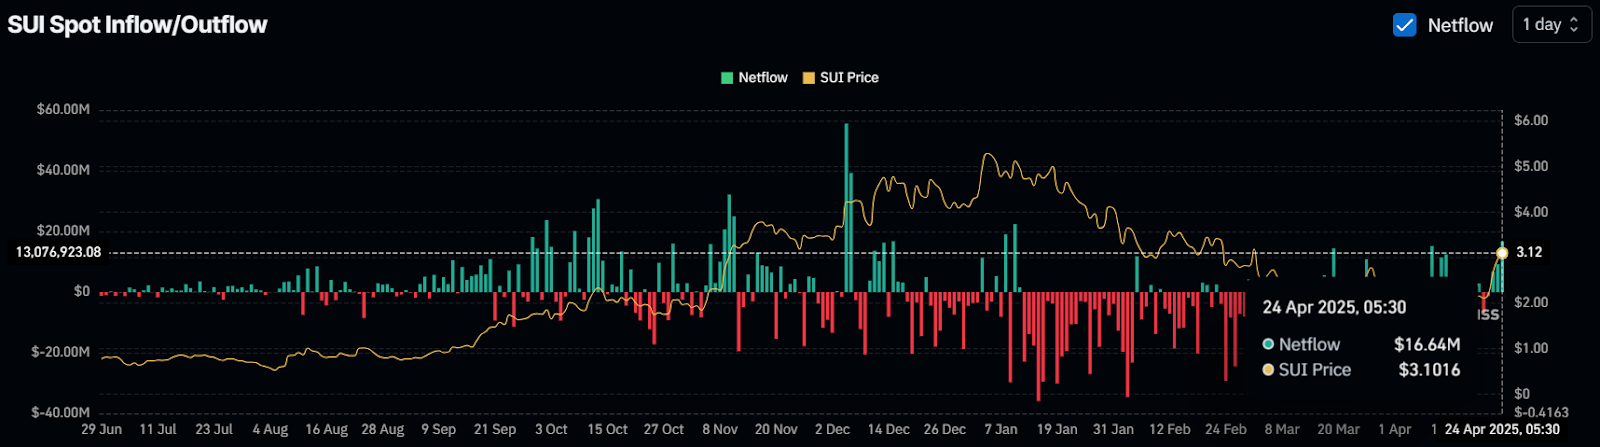
SUI Spot Inflow/Outflow | Source: Coinglass
Such an inflow of SUI coins into exchanges can create selling pressure and lead to a further price decline.
This is not the first day that exchanges have registered notable inflows. On-chain metrics reveal that on April 22 and 23, 2025, exchanges recorded $15.90 million worth of SUI coins.
This inflow began when the SUI coin price broke out from the descending trendline and started to witness upside momentum.
$72.68 Million Worth of Bullish Bet
However, traders appear to be following the current bullish market sentiment. According to the SUI Exchange Liquidation Map, traders are over-leveraged at $2.916 on the lower side (support) and $3.431 on the upper side (resistance).
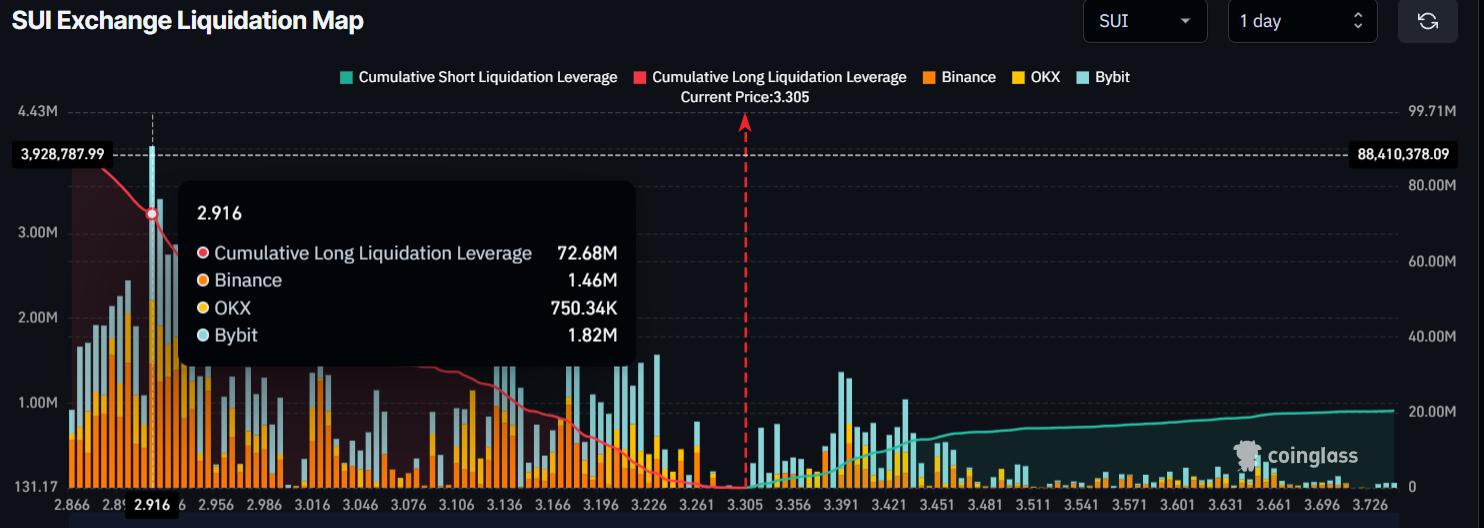
SUI Exchange Liquidation Map | Source: Coinglass
Additionally, traders hold $72.68 million worth of long positions on the lower side and $11.89 million worth of short positions on the upper side, indicating that bulls are currently dominating the asset and could support the SUI coin price in maintaining this upside momentum.


