SUI Price Prediction: Can SUI Surpass $4.48 As Transactions Hit New ATH?

Key Insights:
- SUI price action showed it had completed the fourth wave recently and was starting the fifth wave rally at the time of writing.
- SUI surpassed 10 billion total transactions.
- The SUI heatmap showed major support at the deep red zone at $2.80-$2.95.
The SUI Network (SUI) price prediction chart showed the altcoin reached $3.37, upscaling the odds of hitting the $.4.4880 zone.
SUI Price Prediction
SUI depicted a clear five-wave Elliott structure where the price has completed the fourth wave recently and started the fifth wave rally.
Wave 2 fell back to $2.00 after Wave 1 hit a high of $2.65. Higher wave 3 was extended to almost $3.95 before the price dropped back to the $3.20 – $3.25 band, portraying the present wave 4 low.
Based on wave 5, the projection visible near-term target for SUI is $4.4880.
This sentiment is consistent with the common Fibonacci extension of waves 1 and 3 in continuation of the overall chart trends.
However, if rates do not sustain above the $3.20 mark, the structure could be in jeopardy.
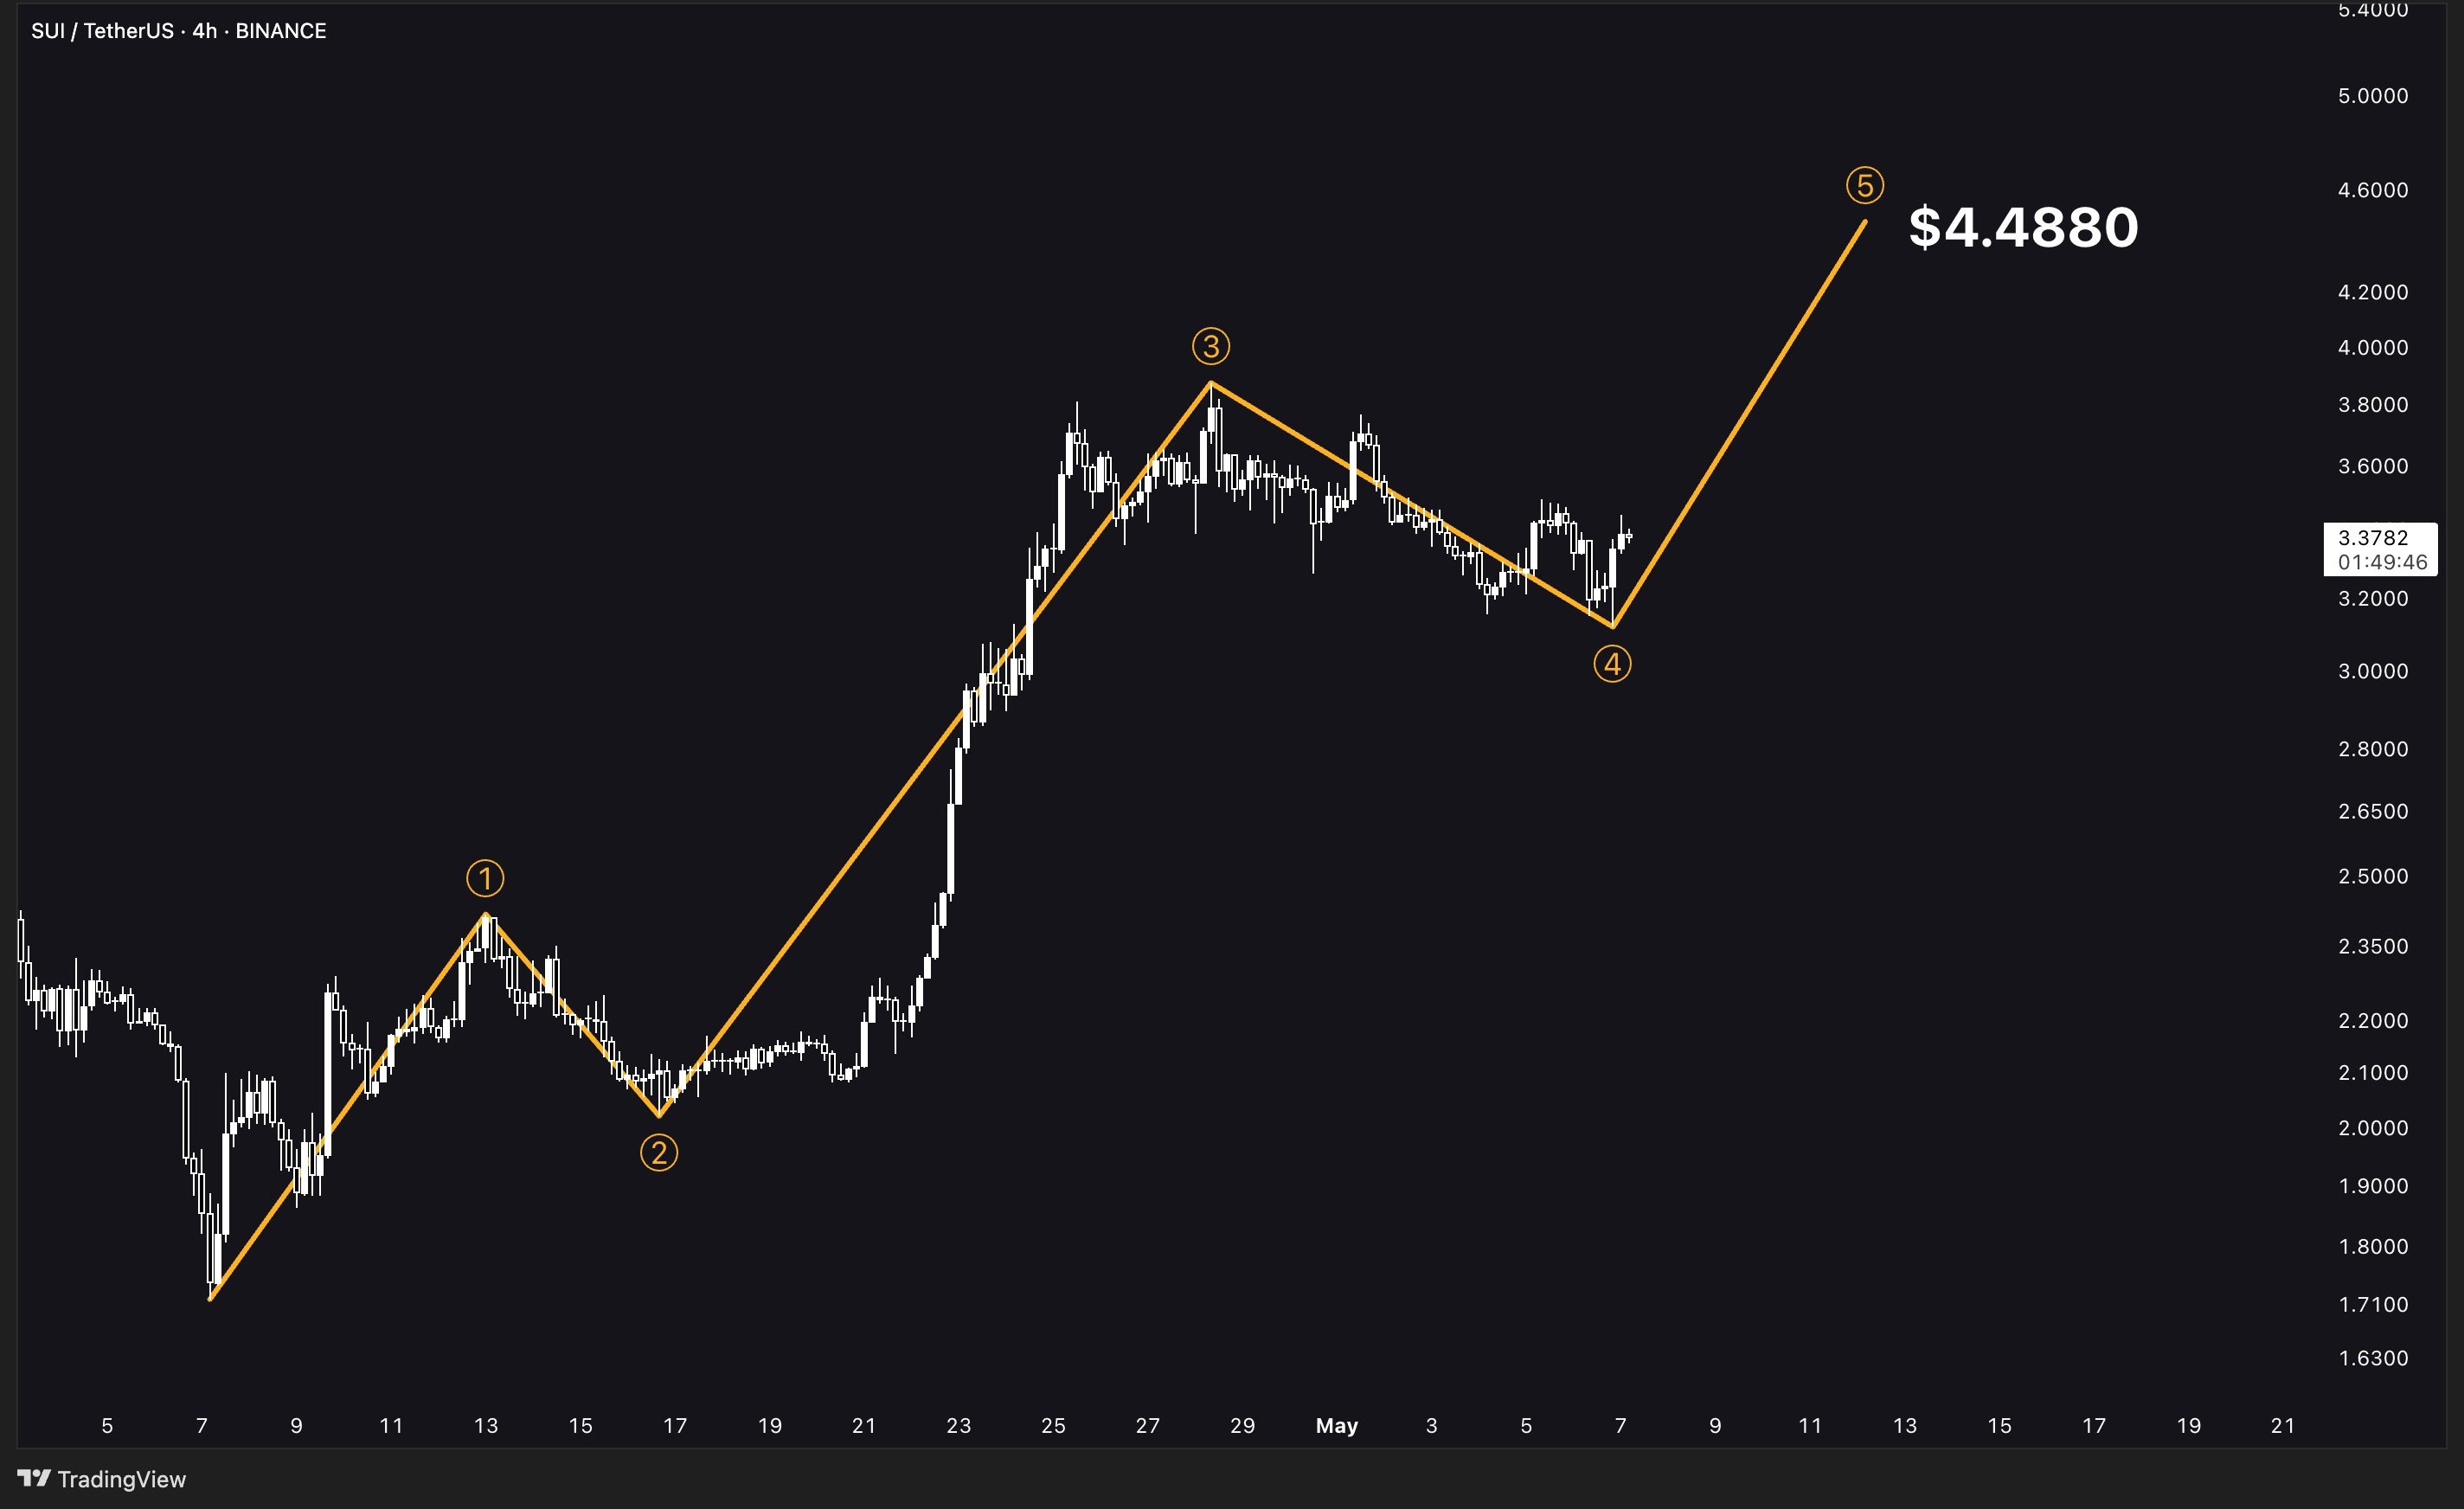
A price break below $3.00 has the potential of presenting the bearish wave count, which may cool SUI and possibly pressure it towards $2.80.
While writing, it was trading at $3.3782 and may have given an initial bullish reversal from the fourth wave.
A price breakout above the $3.60 level might bring a further upswing in the value. Summing up, the structure is still pointing upwards and the recent low was maintained.
However, if buying pressure continued and the momentum increased, this price can get to $4.4880.
However, if there is no breakout of higher highs recently or have lower volume it may halt the run to the upside and has potential for a consolidation or even a reversal.
SUI Crypto Total Transactions
SUI was accomplished a total transaction of more than 10 billion in the latter part of May, 2025 and out of this 3.52 billion was related to block activity.
This was a stark increase compared to 2 billion targets set for October 2023 and 7.5 billion for December 2024.
The fact that the growth is constant month on month in 2024 indicated increasing usage and uptake of the networks.
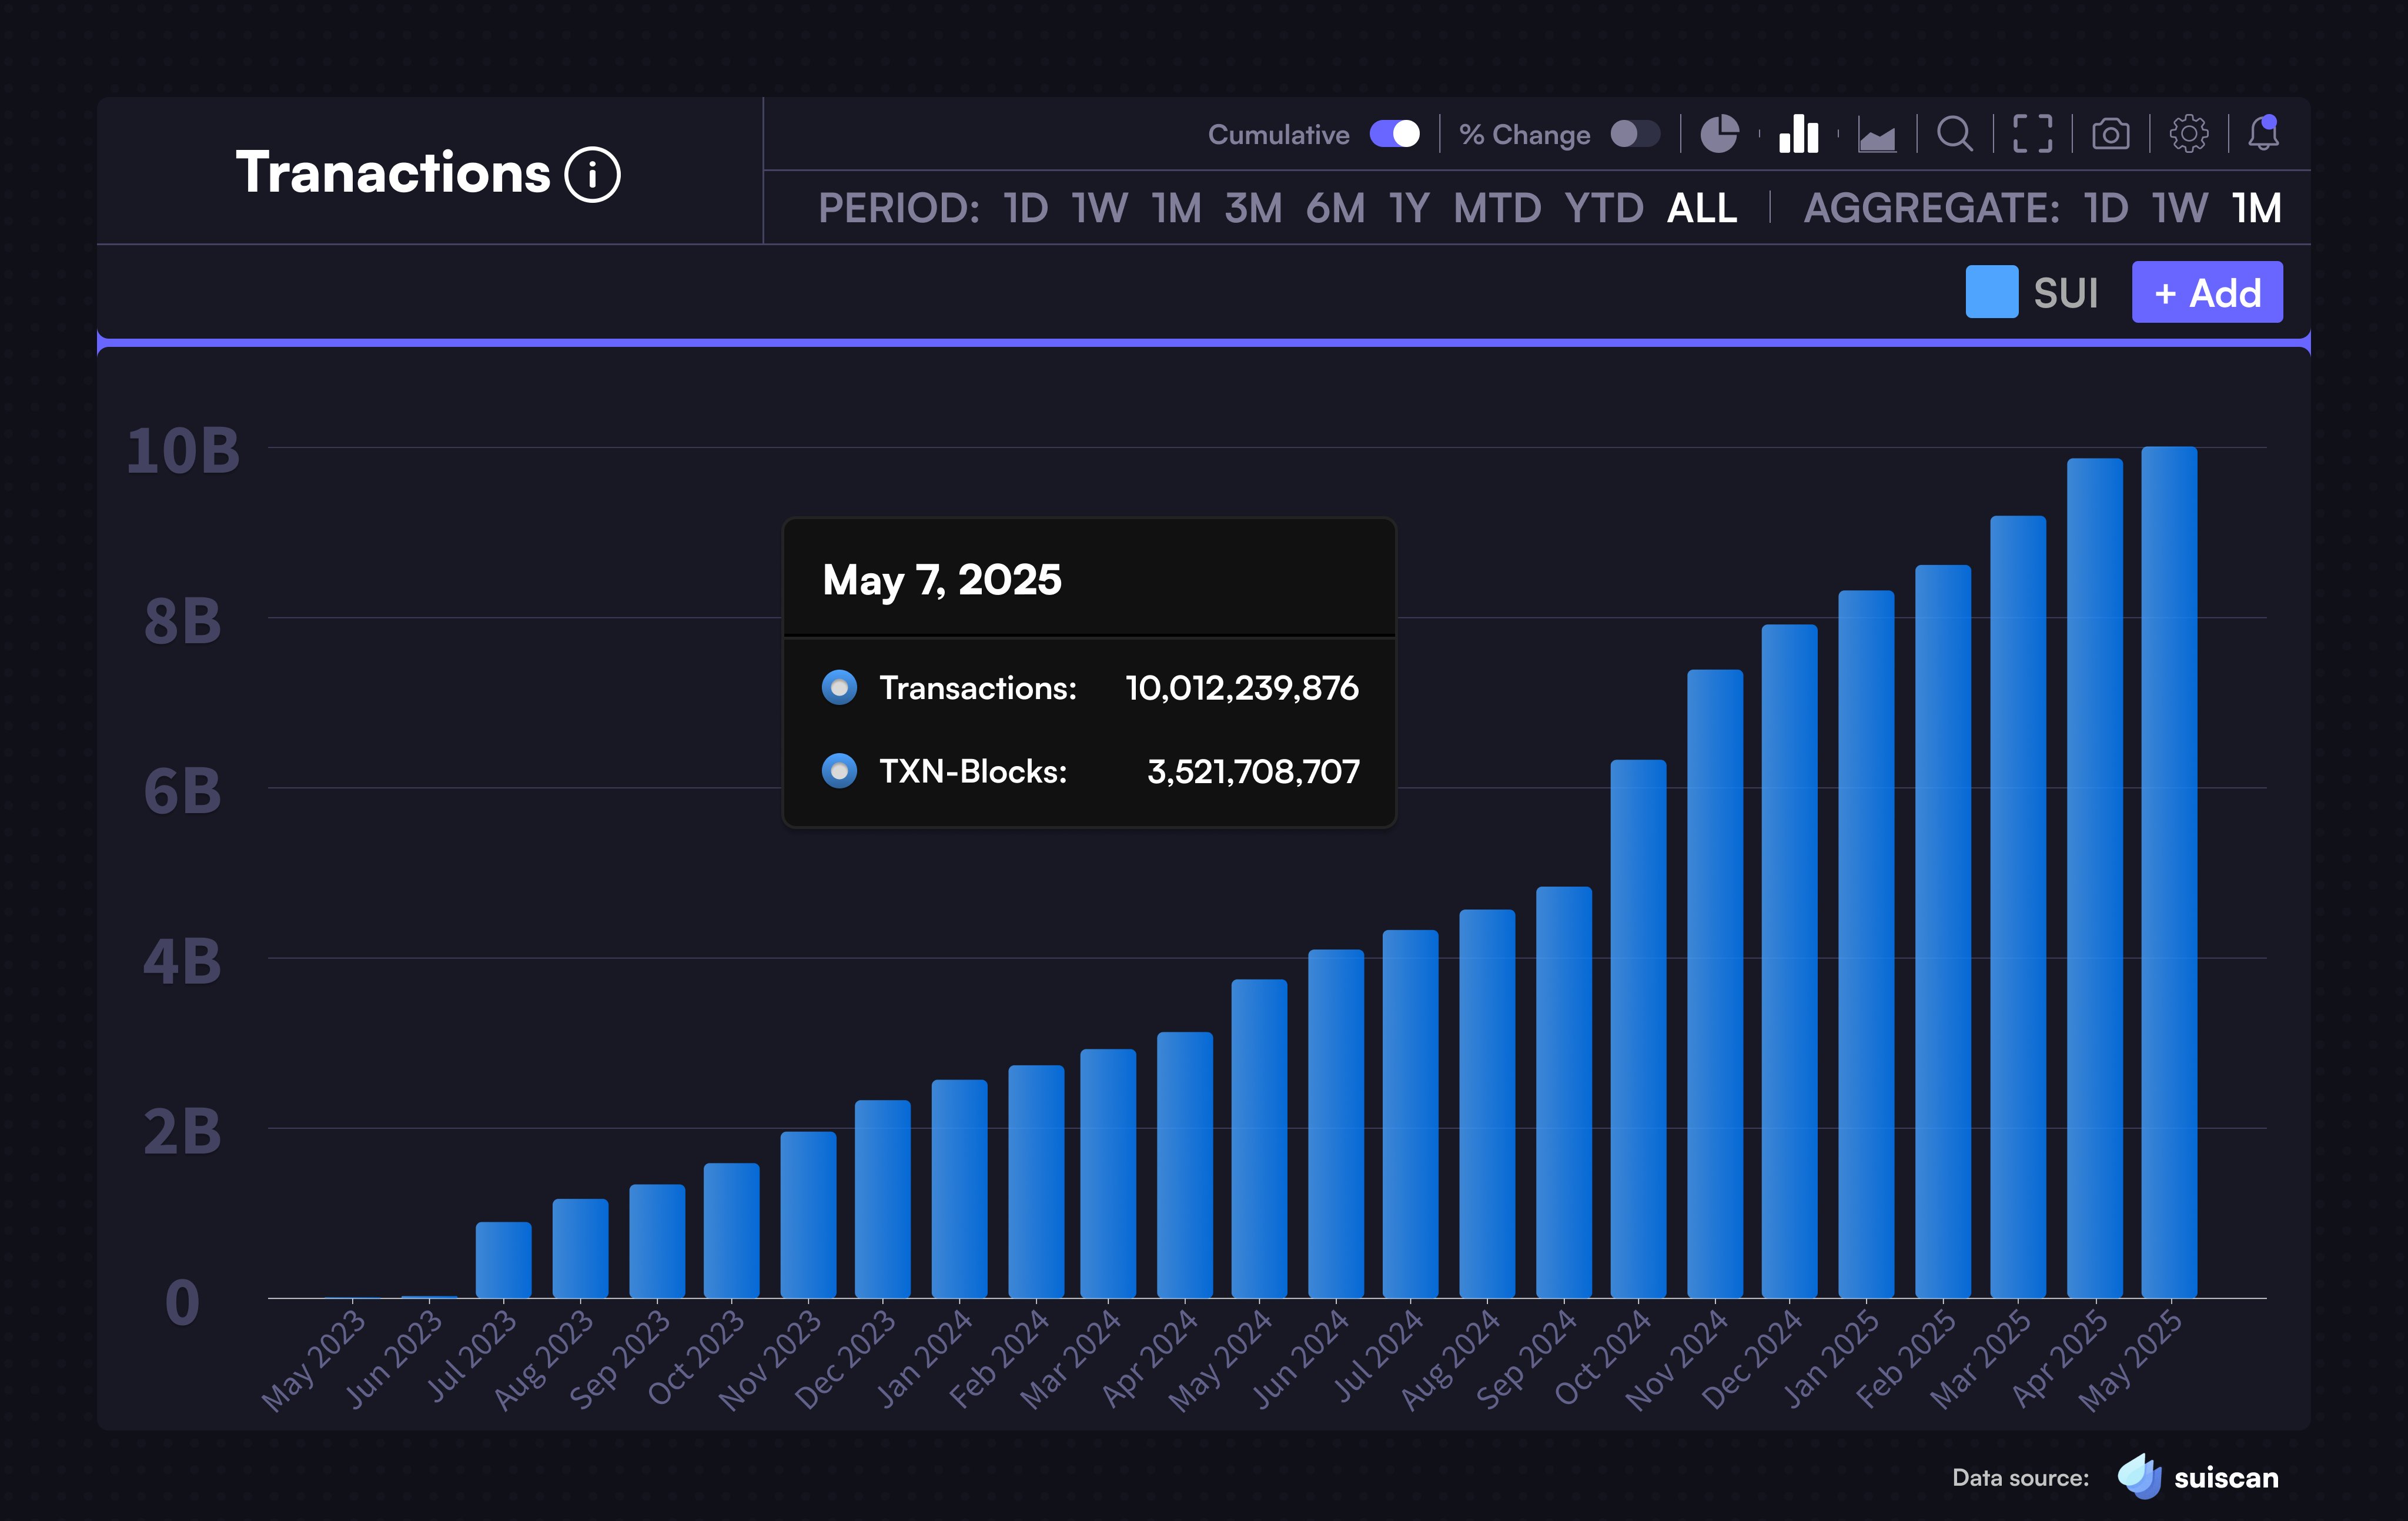
This transactional rise could potentially be sustained as a positive for long term price because of active and intensive use of the token.
But if the growth is not supported by new capital or growth of the ecosystem, the price might stop growing.
On the upside, continuity nurtures further movement; on the downside, profits coming and a crowded network may trigger reversals.
SUI Liquidity Cluster Zones
The SUI heatmap provided a vivid idea of how much liquidity had accumulated in what levels or ranges, and therefore, where deep red zone at $2.80-$2.95 showed major support.
This area might offer support, and if SUI goes down, it may be the area that might provide the bounce.
On the other hand, turn into a weak sell wall from $3.60 to $4.00, which also meant there were far fewer obstacles to any upward movement.
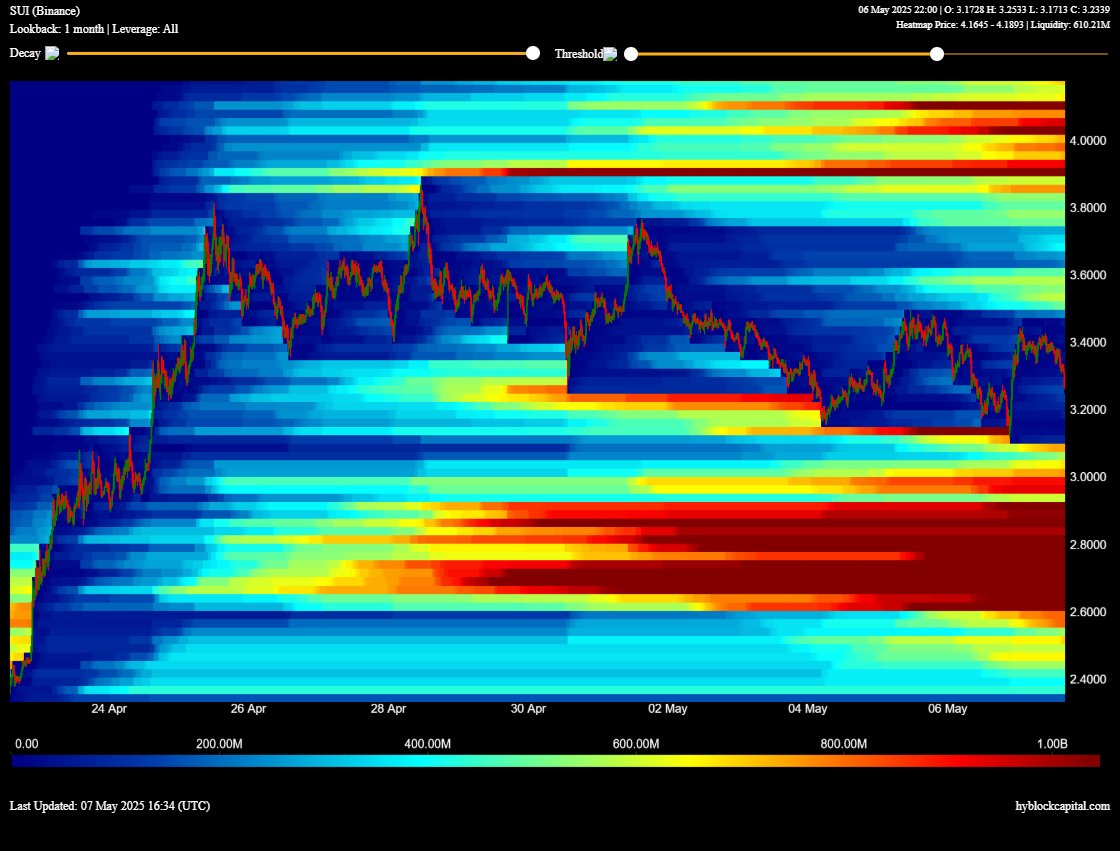
If bulls took the price back to $3.60, there could be a chance to retest the $4.00 in the medium term due to low liquidity drag factor.
With its current price of $3.23, SUI remained inside the mid-price band.
A dropping below the $3.00 level might lead to $2.80 retracement, while a breaking through $3.45 might lead to $3.80 levels.
The price above $4.00 may fail to further rise higher as much as demand is too dense at the upper levels.
Combined, the chart indicated that volatilities may increase if the price gets nearest these liquidity zones.


