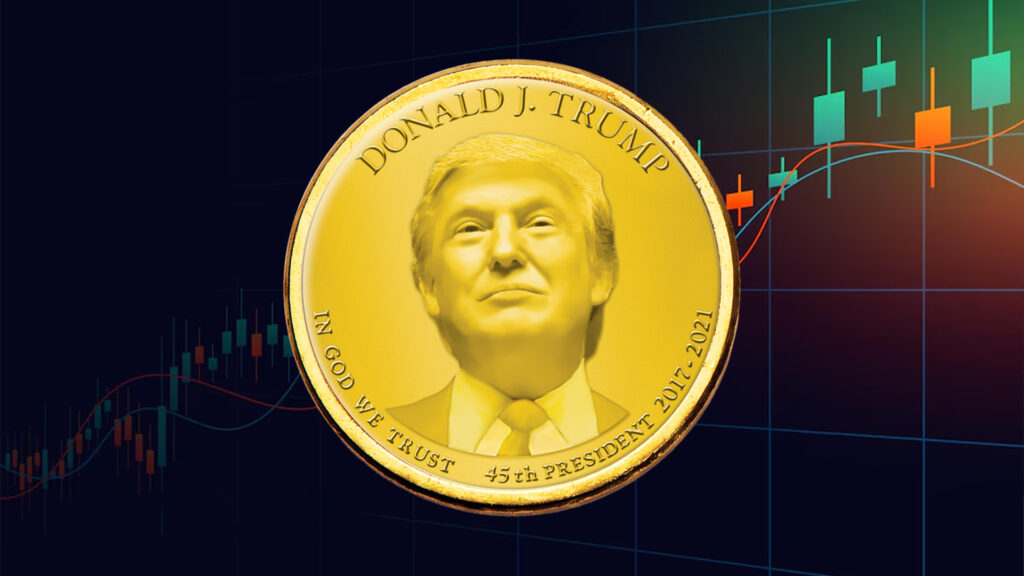
TRUMP Coin Price Breaks Out: Will Momentum Sustain Toward $8.80

Key Insights:
- TRUMP broke above the $8.20 resistance after a prolonged consolidation phase, suggesting increasing bullish pressure and potential upside movement.
- TRUMP’s upward move may face resistance at $8.80, while a failure to hold above $8.40 could trigger a reversal.
- TRUMP showed weak volume support during the breakout, raising concerns about sustainability without renewed interest from major market participants.
TRUMP coin price saw a breakout pattern after sustaining a continous consolidation pattern.
The price was confined between $7.80 and $8.20 during this extensive period.
During this period of market indecision, both bulls and bears failed to establish dominance over the price movement.
TRUMP Coin Price Prediction
The price rose above $8.20 and established a breakout that possibly indicated rising bullish sentiment.
Inside the accumulation zone, the price formed a pattern of increasing highs and lows, reflecting increased buying pressure.
With a recent price breakout at $8.40 and continued trading near $8.49, the bulls attempted to push the price toward $8.80 within the upcoming time period based on the upward movement shown through the arrow.
The prevailing bullish pressure made $8.80 an upcoming potential barrier which would serve as resistance.
Thus if the price sustained below $8.40 after exiting its former range it would undermine the breakout, thus, triggering a possible price drop towards either $8.00 or $7.80.

The trend supported further upward price movement because volatility levels tended to rise during breakouts.
Moreover, the Volatility Index recorded 8.284 points which trailed the price by a small margin, indicating amplified market volatility.
A decrease in the index value could have indicated that the price would experience renewed consolidation.
Further, the Whale Index alternatively reached a score of -177.2100 which indicated a negative position stance from major investors.
But, an upward breakout indicated that smaller market participants alongside retail investors were possibly triggering this price increase even though larger stakeholders indicated negative sentiment.
A decrease or continued negative whale participation would create potential scenarios for market pullback.
The price could have moved upward toward $8.80 but would likely face bearish pressure directing the market toward $8.00 or $7.80 in case support at $8.40 would fail to hold.
Shifting TRUMP Coin Sentiment Around Key Resistance Levels
Further analyses into the Long/Short Ratio showed changing market sentiment through distinct shifts from start to finish during the review period.
The taker trade volumes showed evidence of constant battling forces between sellers and buyers.
During the initial period, the ratio stayed close to neutral values before it rose substantially on 09 at 15:00 hrs reaching a near maximum point of 1.10.
The surge occurred during a price penetration that increased long positions with bullish market positions.
At this moment the volume ratio rose, possibly to move prices into the same area where it had previously peaked at $8.40-$8.49.

The ratio then recorded a fast decline starting on 09 at 23:00 hrs until it fell under 0.95, which indicated increasing short positions.
The ratio indicated potential evidence of both bearish trend deceleration and price-taking activities within the vicinity of $8.49.
Price volatility at $8.40 to $8.80 correlated with short-term optimism followed by skeptical patterns that repeatedly occurred between ratios of 0.95 to 1.05.
By 12th, at 15:00hrs the most recent data indicated a ratio of 0.85 suggesting bearish market sentiment which could lead to price tests either at $8.00 or $7.80 if negative sentiment persisted.
Undermining Breakout Momentum, Hints at Potential Reversal
Finally, the volume activity remained at minimum levels throughout this entire period, indicating decreased market participation.
This fact could be proved since stable prices with tiny trading bars indicated minimal traders engaged with this price level during the studied timeframe because the market displayed uncertainty around $8.40.
The $7.80–$8.20 consolidation range breakout led to this potential market rest period while traders observed market direction.

Price stability near $8.49 occurred with low trading volume and thus reduced the speed of movement toward the $8.80 resistance.
The absence of continuous buying support during that period disproved the breakout momentum observed previously when no substantial buying activity.
Therefore an unexpected surge of trading volume likely led to price testing of $8.80 and possibly beyond.
The price would normally fall back to either $8.00 or drop down to $7.80 when a bearish volume surge happened.
However, the market showed no signs of new interest in potential key support areas between $8.40 and $8.20.


