Will Bitcoin Crash to 105K or Break Higher Above 111K Shorts Cluster?

Key Insights:
- BTC faces heavy short positions near $110K-$111K. A breakout could trigger a swift short squeeze, causing a Bitcoin crash.
- Support holds at $107K-$108.5K; a break below may lead BTC toward $105K or lower.
- Institutional buyers like Metaplanet boost BTC demand, holding 7,800 BTC amid declining OTC supply.
Bitcoin was trading near $109,000 when writing, facing a crucial decision point. The price has recently struggled to break above the $108,000 to $111,000 range, where many short positions cluster. This concentration of shorts could trigger a short squeeze if the price breaks higher. Conversely, failure to clear resistance may lead to a correction toward $105,000. Traders are watching these levels closely to determine Bitcoin’s next direction.
Bitcoin Price Struggles Around the 108K to 111K Resistance Zone
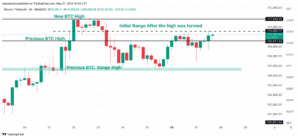
Bitcoin has encountered resistance near $108, to $111,800, marking a critical barrier. Multiple attempts to break this zone have met selling pressure, causing retracements. The price has formed lower highs after reaching an all-time high near $111,850, suggesting hesitation among buyers.
The cluster of short positions just above this level adds to the tension. According to market data, many traders have placed shorts between $108,000 and $111,000. This concentration means that if Bitcoin manages to push through, short sellers may be forced to exit positions quickly, causing a rapid upward move.
However, if the price fails to break this cluster, downward pressure might increase. The resistance around $110,750 remains a key level to watch for signs of either continuation or reversal.
Support Levels and Potential for a Bitcoin Crash
On the downside, Bitcoin’s support zones near $108,500 and $107,000 are crucial. These areas have provided buying interest recently, helping the price bounce from dips. A break below these levels could open the door for a larger correction.
If Bitcoin falls below the $107,000 support, the next major support zone lies between $105,000 and $102,400. This range acted as support during previous pullbacks and may attract buyers again. Falling below $105,000 would suggest a shift in short-term momentum toward bearish conditions.
Analysts point to these support levels as key indicators for market direction. A sustained drop below $105,000 could trigger additional selling, while holding above it would keep the overall bullish trend intact.
Market Sentiment and Liquidation Activity Show Low Chances of a Bitcoin crash
Recent liquidation data shows significant short liquidations around early May, reflecting a sharp price increase that squeezed short sellers. This event suggests bullish momentum earlier in the month. Meanwhile, spikes in long liquidations appeared around May 24-25, indicating increased volatility and temporary pullbacks.
The current imbalance, with many shorts clustered just above $110,000 and fewer longs beneath $108,000, creates an area of potential price attraction upward. If the price reaches the short cluster and squeezes those positions, Bitcoin may see a swift rise above $111,000.
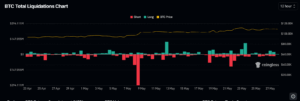
Yet, the presence of liquidations on both sides signals cautious trading. The market is volatile, with traders managing risk amid uncertain conditions. This volatility often precedes sharp price moves in either direction.
Institutional Activity and Long-Term Trends
Major investors are increasingly obtaining Bitcoin, helping to keep the bullish trend going. The American cryptocurrency investment platform Metaplanet recently got over 1,000 BTC, expanding its total number of BTC to 7,800. To help buy additional BTC, Metaplanet issued $50 million in 0% ordinary bonds, showing it is serious about building its Bitcoin position. MicroStrategy has already bought over 580,000 BTC. The decline in available supply, as a result of these acquisitions, usually provides a basis for price support.

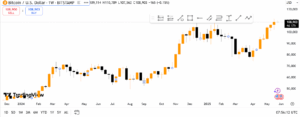
Bitcoin has continued to move higher and reach new tops every week since early 2024 on the weekly chart. Recently, weekly candles have become indecisive, featuring less room in their bodies and small losses when they close. Such an indication may mean short-term rest before the next main shift.
Exchange data also reveal that holdings of Bitcoin stored on OTC exchanges have gone down sharply. The market now has 371,000 fewer BTC than it did at the start of 2021.
Overall, the trend strengthens Bitcoin’s value, though its daily and hourly movement still correlates with important technical levels.