Will PEPE Coin Rally 123% After Golden Cross & Breakout Confirmation?

Key Insights:
- PEPE coin formed a golden cross with the 50-day MA crossing above the 200-day, signaling a potential long-term bullish trend.
- A confirmed breakout above $0.00001615 could push PEPE toward the $0.00002830 resistance, representing a 123% potential gain.
- Analysts warn that a drop below $0.000010 would invalidate the bullish setup.
PEPE Coin is receiving renewed attention after a golden cross, pointing to an upward market trend for the meme coin.
The current trend is being formed as the 50-day moving average crossed the 200-day on the daily chart and may lead to a sustained rise in price.
PEPE Coin Golden Cross Pattern Suggests a Potential Uptrend
Tom Tucker, a technical analyst, noted that PEPE Coin completed a golden cross on the daily chart. It happens when the 50-day moving average rises above the 200-day moving average.

Historically, this pattern is understood to indicate a better outlook from investors. This shows that prices are going up faster than before, suggesting a good time for traders to make profits over a longer term.
As of the latest data, PEPE Coin was trading around $0.00001286. The upward trajectory began after prices stabilized above $0.00001000, establishing a short-term support level.
Consequently, this stability has allowed the moving averages to align in favor of a potential bullish continuation.
The rise in daily trading volume during this phase suggests that market participants may be positioning for further upside if the pattern holds.
PEPE Coin Breakout Could Open the Path To $0.00002830
Another analyst, CryptoFaz, has identified $0.00001615 as a key breakout level on the PEPE Coin chart. A confirmed move above this level may open a path toward the next resistance target at $0.00002830.
This represents a possible 123% price increase from the breakout zone, aligning with previous high-confluence resistance areas observed earlier in the year.

More so, chart patterns suggest that PEPE has been consolidating within a defined range. The recent price structure showed higher lows forming on the chart, a common precursor to breakout movements.
Notably, technical traders often view this type of consolidation as a setup for volatility expansion. Should the price exceed $0.00001615 with sustained buying pressure, traders may look to the $0.00002830 level as the next target.
Support at $0.000010 Remains Critical for Bullish Continuation
While the overall setup appears constructive, CryptoFaz cautioned that the bullish thesis depends heavily on PEPE Coin maintaining support above the $0.000010 mark.
This level has acted as a structural floor during recent market pullbacks. A breach below this point may weaken bullish momentum and potentially reverse the trend.
Furthermore, a breakdown beneath it could trigger stop-losses and prompt a shift in sentiment. For now, the price continues to trade within the defined breakout range, but the market’s reaction near this threshold will likely determine the next move.
PEPE Coin Technical Analysis: Breakout After Recovery
Meanwhile, PEPE Coin has displayed a gradual upward trend over the past 30 days, with prices fluctuating between $0.000011 and $0.000013 levels. Despite short-term volatility, the meme coin maintained higher lows, suggesting steady accumulation.
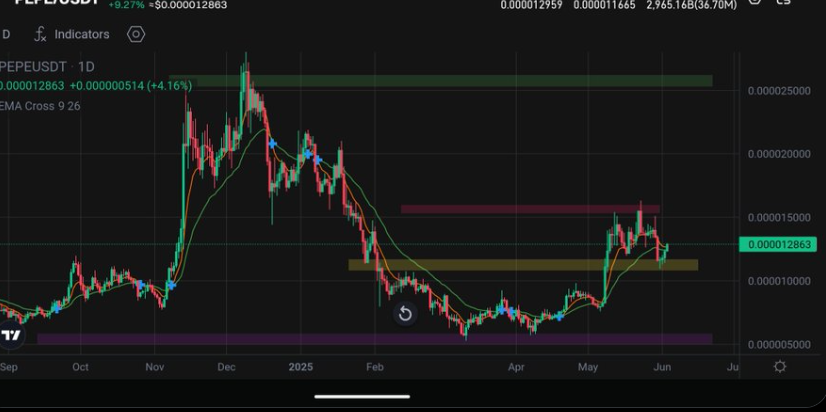
Additionally, a breakout above $0.00001320 could confirm bullish momentum, while holding above the $0.00001100 support zone remains critical. The current structure favors buyers if market volume increases.
A close watch on the $0.00001250–$0.00001300 resistance band is critical, as this zone could determine the next short-term direction. Technical indicators, such as moving averages, also reflect improving trend strength.
At the time of writing, PEPE coin traded at $0.00001237, down 1.24% in 24 hours. The price faced intraday resistance near $0.00001285 and bounced off support around $0.00001196.
Volume rose 47% to $1.13B, suggesting strong buyer activity as the coin attempts to maintain upward momentum.