Will Shiba Inu Bounce Back After 5% Decline in a Day: Details

Key Insights:
- SHIB fell by -5.6% in the last 24 hours on the Binance chart, trading at $0.00001484.
- Several SHIB/USDT shorts accumulated around $0.00001664, totaling about $4.56M.
- Analysis of the Aggregated Orderbook Liquidity Delta Chart (±1%) revealed fluctuating liquidity.
Shiba Inu (SHIB) dropped 5.6% in the last 24 hours on Binance. Its current price is $0.00001484. The decline has raised concerns about a short-term market correction. This follows a recent surge in prices earlier this week.
Shiba Inu Price Analysis
Shiba Inu experienced a bullish trend that pushed its price past $0.00001490. This movement led to the Break of Structure (BOS), signaling a potential shift in market direction.
Yet, the price could not stay above the BOS level and dropped downwards. Around the $0.00001750 mark, a CHOCH formation became visible, hinting at a move from bullish to bearish in the market.
With the CHOCH pattern, traders knew there could be an upcoming reversal, as the previous uptrend could fade.
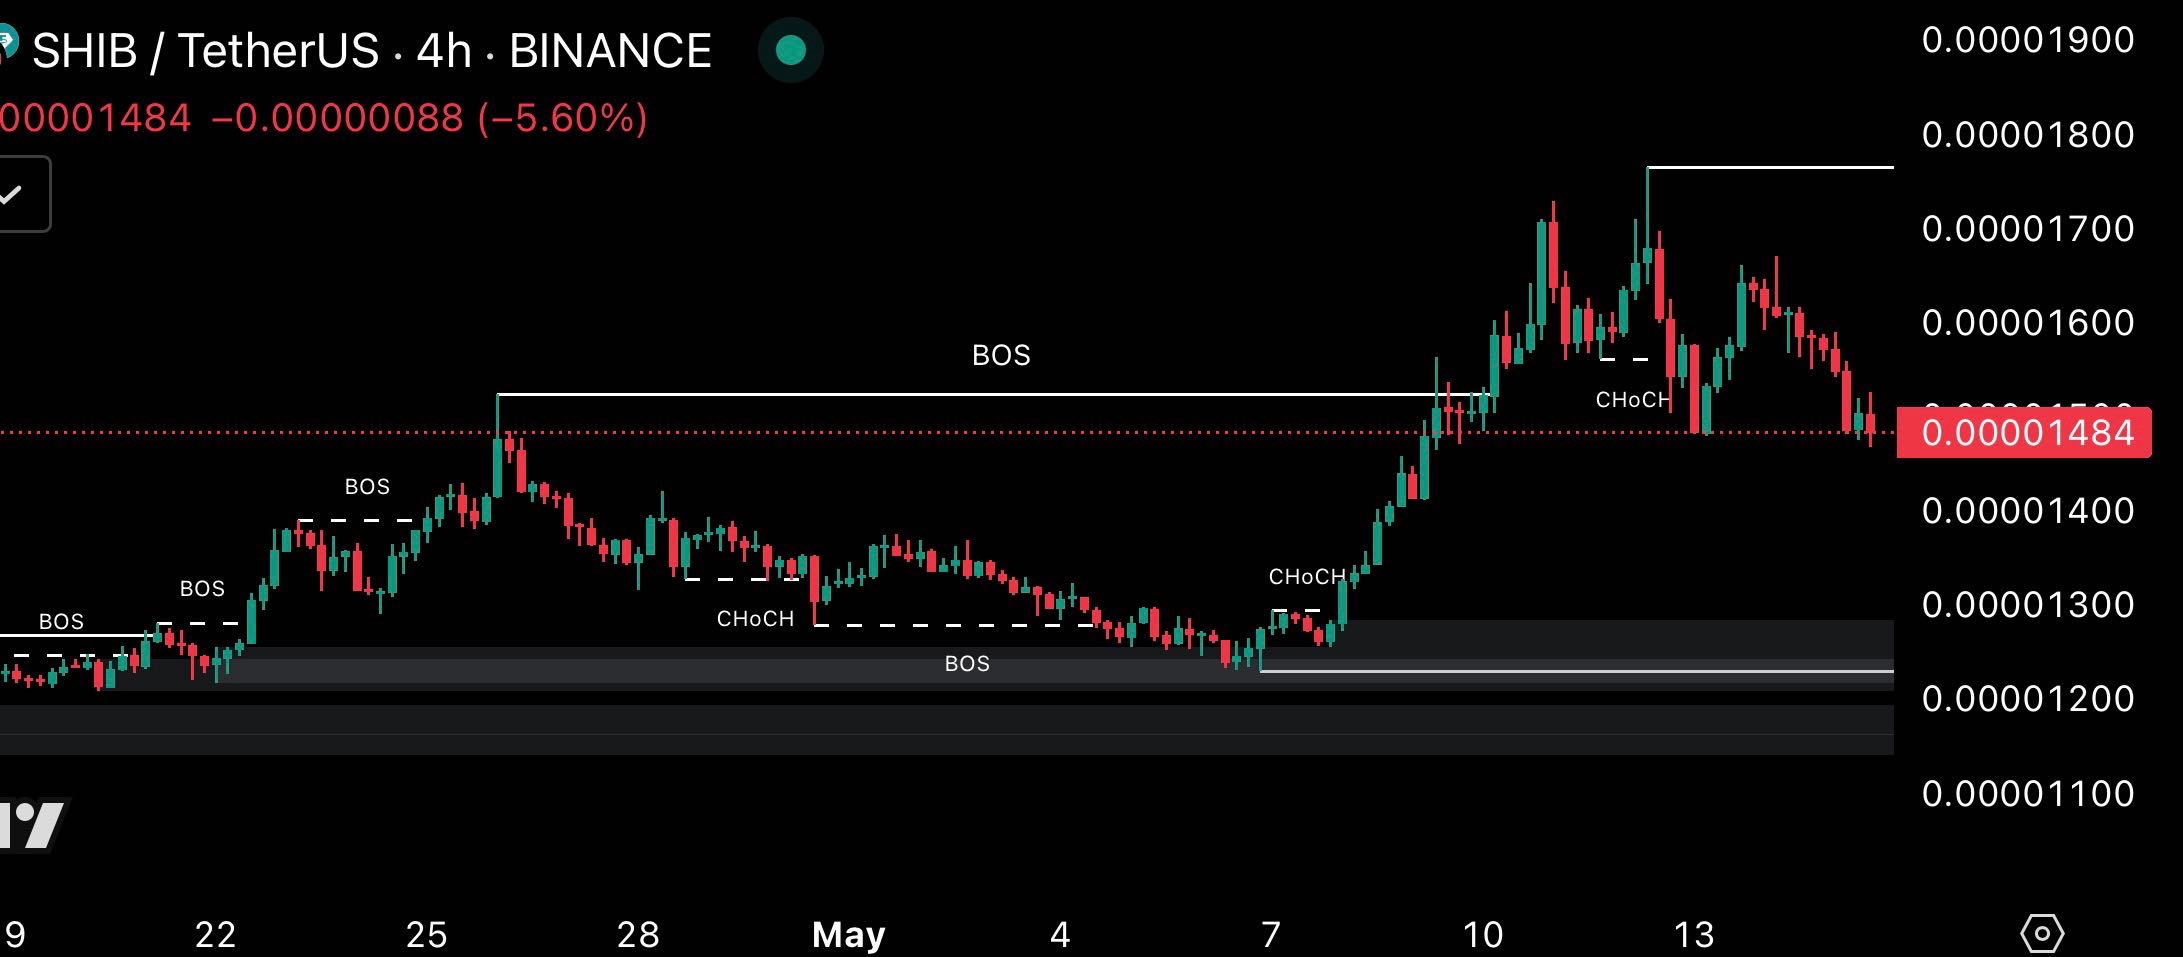
Once the CHOCH was in place, Shiba Inu saw a decline, pushing the market toward $0.00001450 as support. If this support level were broken, the price could head further down towards the level at $0.00001250.
If the $0.00001450 support level did not break, the price could revisit the previous BOS at $0.00001550. If this level is broken, the downward trend from the CHOCH could reverse. This would allow CHOCH to retest $0.00001750 or move even higher.
Shiba Inu Liquidation Map
Binance SHIB/USDT liquidation map data showed shorts piling around $0.00001664. The total value of these positions reached approximately $4.56M. This meant that a big collection of short positions would be triggered if the price touched this region.
Liquidation for longs was lower than for shorts, starting at around $200K when the price was $0.00001352. As the price increased to $0.00001504, liquidation rapidly declined.
Short positions clustered in the $0.0000152 to $0.0000158 range. A larger number of positions were found above $0.000016.
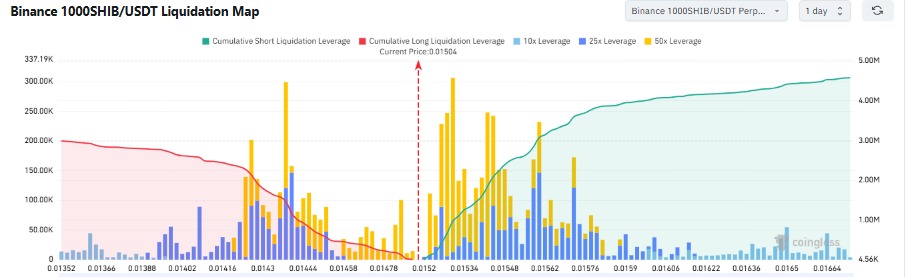
Higher leverage long holdings became more dispersed toward the bottom and were visible below $0.0000148. If Shiba Inu price increased and hit $0.0000152, the short liquidations could initially hold the market back.
But if it does break above $0.0152, it could create a cascade that would propel the price sharply upward. No clear liquidation settlements exist near the current price if the price falls. This suggests that selling due to prominent positions was not the most probable cause.
A large number of leveraged longs exist below $0.0148. If those price levels are tested, it could lead to increased market movement. More of these positions put more downward pressure on prices, making it likely for prices to fall immediately.
SHIB Aggregated Orderbook Liquidity Delta
Analysis of the Aggregated Orderbook Liquidity Delta Chart (±1%) revealed fluctuating liquidity. The green bars represented positive delta, indicating more buy orders within 1% of the mid-price. On the other hand, red bars show negative delta, signifying more sell orders.
For instance, positive delta reached approximately $1.5M, suggesting strong buying pressure. Conversely, negative delta hit around -$1.25M low in mid-January, indicating significant selling pressure.
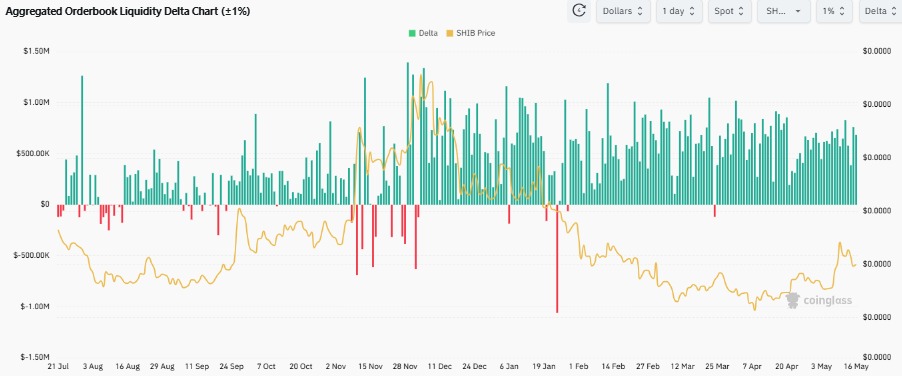
However, Shiba Inu price movement did not always directly correlate with the delta. A positive delta could suggest potential upward price pressure as more buy orders exist near the current price.
Negative delta might indicate potential downward pressure. However, this was a short-term indicator, and sustained price movement depended on broader sentiment and order flow beyond this 1% range.
Significant positive or negative delta values signal potential short-term price direction. However, confirmation with other indicators was advisable.


