XCN Crypto At A Technical And Sentimental Crossroads: Details

Key Insights:
- XCN crypto faced resistance at $0.024; a breakout could push it toward the $0.030–$0.035.
- Onyxcoin’s compressed volatility near 0.048 suggested a potential explosive move in either direction.
- XCN social dominance peaked at 3.349%, hinting at heightened interest.
XCN crypto has formed a significant price action pattern. Traders are reacting to potential moves in its direction. A breakout could lead to gains or losses.
XCN Crypto Price Analysis
XCN’s 3-day chart shows a descending triangle pattern with lower highs. The price holds steady around $0.01, a key support level.
The bearish pattern generally indicated the possibility of a breakdown. However, more recent price action injected doubt and indecision.
XCN crypto closed at approximately $0.01916, just below the falling resistance trendline. The trendline had declined from about $0.022 to $0.024.
If the price moves decisively above the trendline, it cancels the descending triangle pattern. This would lead to a bullish reversal for the $0.030 to $0.035 range.
However, the bullish breakout fails if resistance at $0.022 and $0.024 holds. A drop below $0.010 would strengthen the bearish trend.
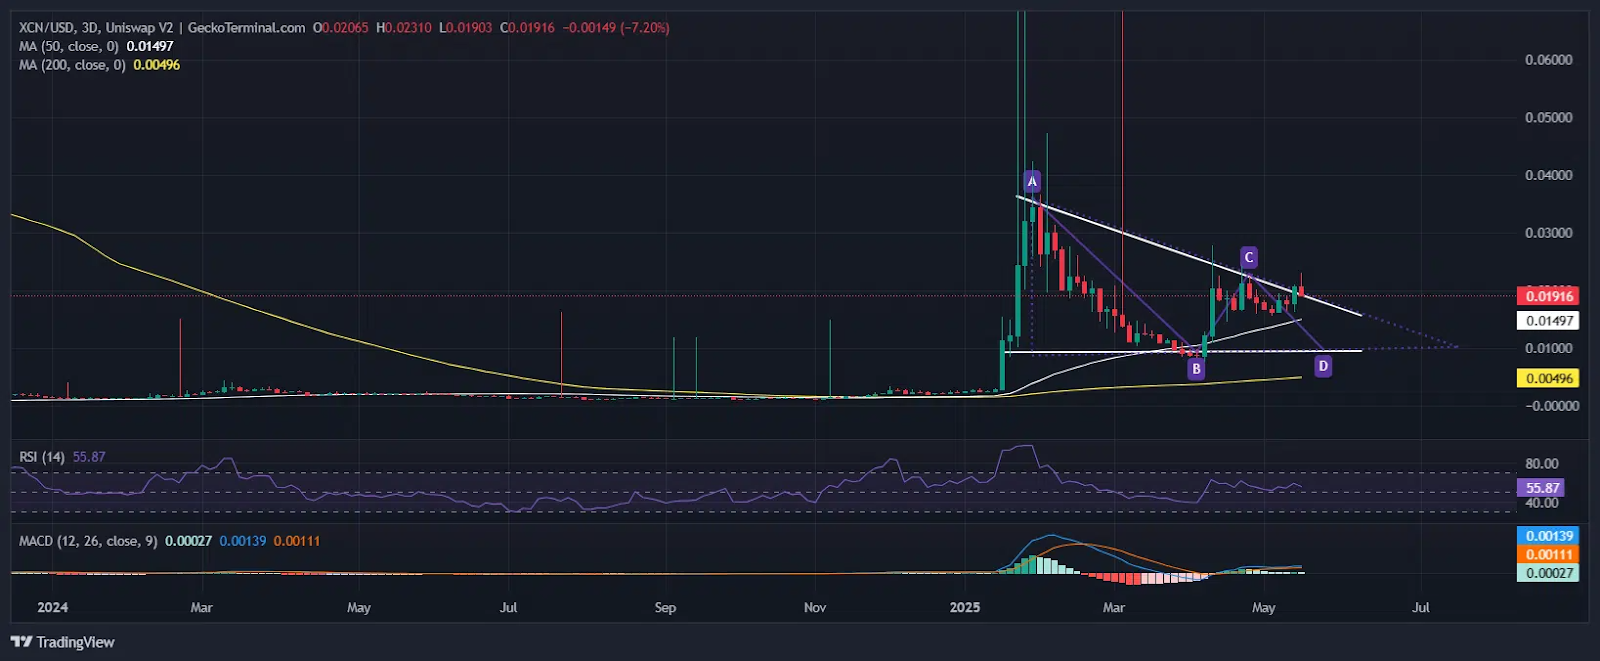
A downward target between $0.005 and $0.006 may develop. This closely aligns with the 200-day SMA at $0.00496. The RSI, which stood at 55.87, signified a modestly bullish momentum. This suggests that buying pressure might increase.
It had not, however, hit overbought levels, so space for more upside existed if the bulls gained momentum. In the meantime, the MACD histogram exhibited a weak bullish bias. The MACD line was 0.00027, sitting above the signal line at 0.00111.
This setup indicates a potential upward crossover that could underpin a breakout if this is accompanied by increasing volume. The price compression trend between the triangle’s vertices A, B, C, and D also supported the hope for an instantaneous reversal.
The market was on the edge, poised for a sharp move. Depending on the dominant trend, it could surge past $0.02400 in a bullish rally or plunge below $0.01000 in a bearish collapse.
Shrinking Movement Hints at Imminent Decision
XCN crypto volatility over 1 week also indicated significant details of the market sentiment and the psychology of the traders. The highest volatility occurred on January 16, 2025, reaching 0.75.
Another spike was observed in mid-April 2025, touching 0.48. These peaks often align with major price shifts. Such movements typically signal breakouts or breakdowns in key patterns.
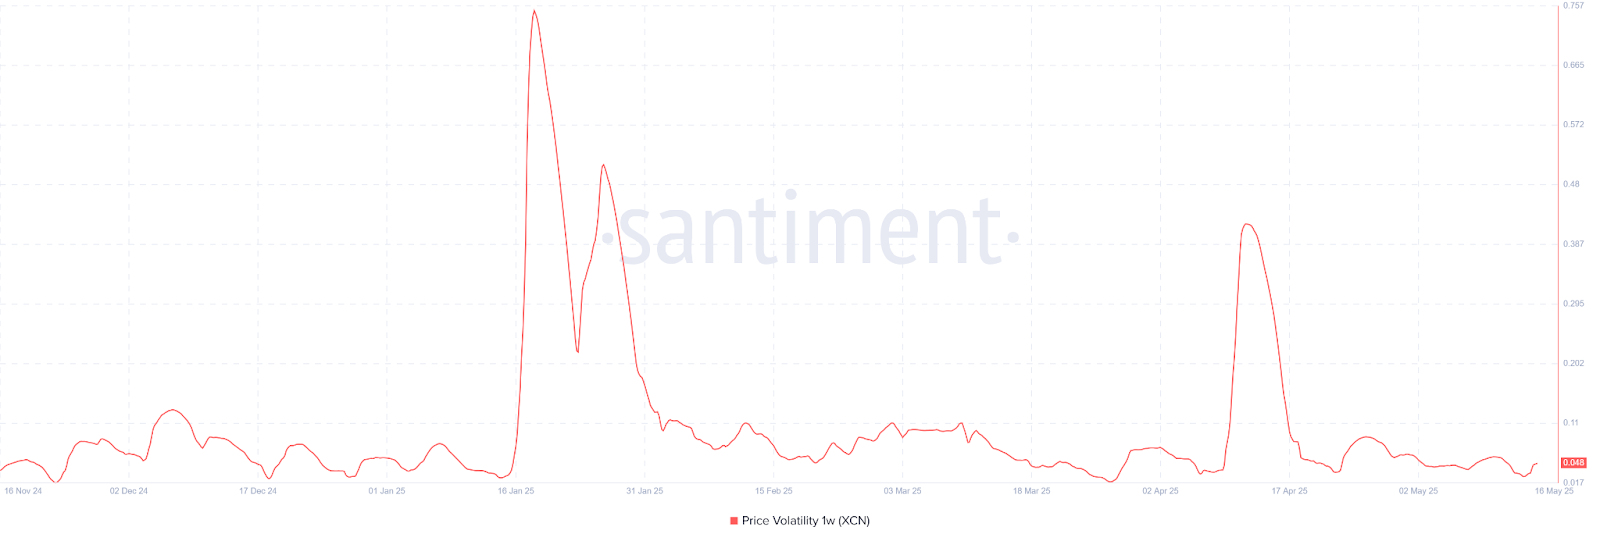
The volatility stood at about 0.048, which is relatively low relative to historical highs. This retreat in volatility might engulf a market consolidation phase, adding to the coiling nature of the descending triangle.
In the beyond, such instances were trailed with explosive actions. As a result, a rise in volatility might be accompanied by a breakout above $0.022-$0.024 or a decline below $0.010. This might indicate either direction.
An increase in volatility with a breakout of price above $0.02400 may cement the bullish argument towards $0.030 to $0.035. If volatility spikes and the price drops below $0.01000, it confirms a continued decline.
The next expected support lies between $0.005 and $0.006, aligning with the triangle’s downside projection.
Rising Attention and Its Uncertain Impact on XCN Crypto
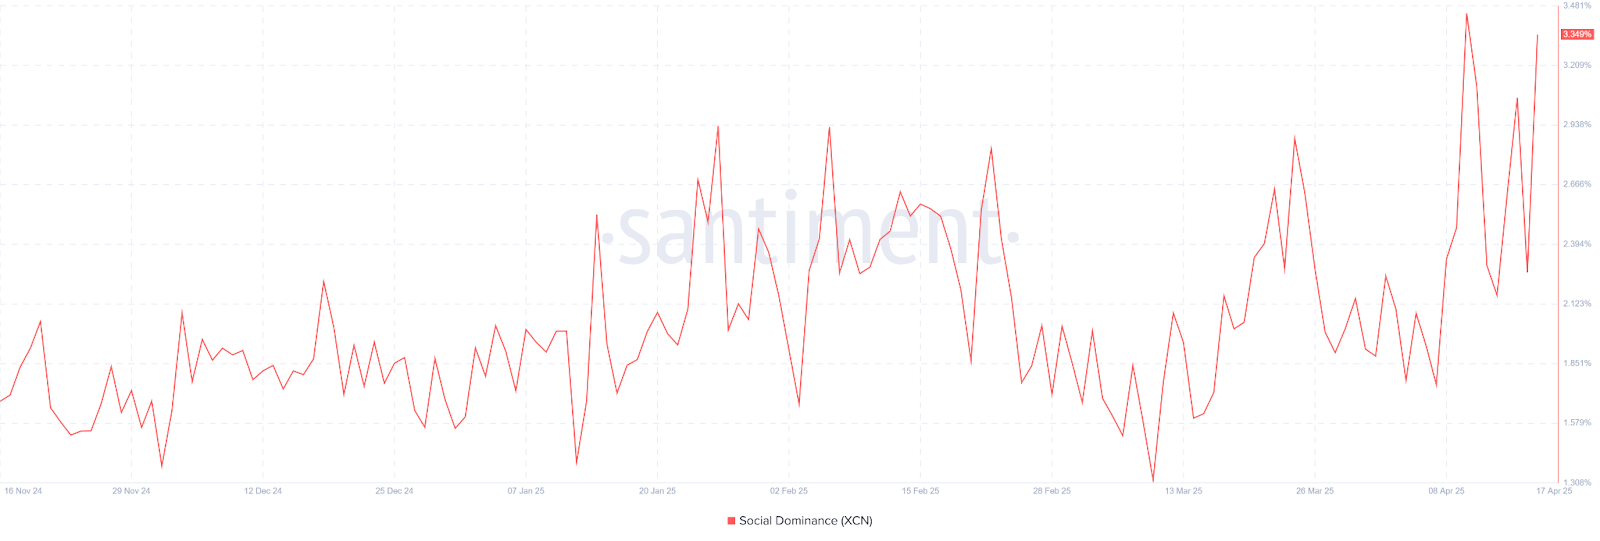
The social presence of XCN crypto continued to increase, culminating in a 3.349% dominance. This was the proportion of mentions focused on XCN relative to all other assets in the market.
The rising social dominance often signaled a growing interest or activity. This implies an expectation of significant price action or reactions to technical patterns.
The higher highs on this measure signaled growing interest. Meanwhile, the price remained tightly coiled within the falling triangle’s borders.
The confluence indicated that retail interest could expect a breakout above $0.024 or a breakdown below $0.010. If social interest is sustained at its elevated level, it might underpin a bullish breakout, taking XCN to the $0.030 to $0.035 range.
Otherwise, if social dominance decreases, it might signify waning confidence or loss of interest. If that were the case, the price might gradually decline in the $0.014 to $0.010 range, postponing any significant movement.


