

Key Insights:
- XDC Network (XDC) breaks the long-term wedge and starts a new bullish phase.
- The next target is the resistance wall near the $0.09 range.
- Buy-side dominance shows strong trader confidence in the breakout.
On Monday, the XDC price broke above a multi-month converging wedge pattern (time frame). This could cause a transition of bearish compression into bullish expansion.
On the chart, traders shared that the XDC price has moved above the upper trendline of a falling wedge. This is historically associated with a bullish reversal.
On the daily chart (1d, BITSTAMP), the price has increased from around $0.058 to $0.0714 since recent lows. As the candlesticks shoot through the descending resistance line, backed by further buying by recent investors, the breakout is visually apparent.
When the price breaks below the wedge’s lower boundary, it hits the $0.058–$0.064 historical support zone. This triggers an immediate and powerful price rebound.
A second piece of evidence is that volume data below the breakout looks increasingly more concentrated. Although the green bars are not meeting current peak levels, the rise in green bars reveals that buyers are gaining ground.
This behavior is typical when a market runs from bearish exhaustion into an early stage of a trend reversal.
Critical Sell Wall of XDC Price at $0.09 Marks Next Test for Bulls
While the breakout is confirmed, XDC price rally depends on surpassing the key resistance zone at $0.085–$0.09.
Analysts identify this zone as a significant “sell wall,” where past sell orders and supply pressure have consistently hindered price advances. It must be broken to maintain the upward momentum.
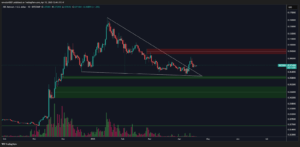
However, this resistance zone has developed in dark red as a ceiling from early January (black shaded area on the daily chart). If it is to continue, bulls must breach this psychological and technical obstacle.
If $0.09 is confirmed as a daily close, it solidifies the breakout signal. Rising volume would further support a price move toward the $0.10–$0.12 range.
However, if again rejected, XDC price can trail back to the breakout zone of $0.068-$0.070, now as initial support.
Market Metrics Show Healthy Liquidity and Bullish Bias
The on-chain and trading metrics make it probable that a move will continue. XDC price has decreased by 1.67% in the last 24 hours.
As per CoinMarketCap, XDC is trading at $0.07188 at the time of writing. It has a market cap of $1.12 billion and a 24-hour volume of $25.88 million, an increase of 2.27%.
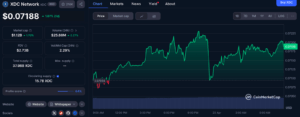
An adequate volume-to-market cap ratio of 2.29% indicates that a mid-cap digital asset has healthy liquidity. The inflation risk from a 37.98 billion total token supply could impact long-term investor confidence. However, the company’s fully diluted valuation (FDV) is estimated at $2.73 billion.
Supply-side dynamics are stable, given that currently 15.7 billion tokens are circulating. There is no specified predetermined maximum supply, and inflationary pressure will be determined by network utilization and other ecosystem-related factors.
Now, sentiment metrics also support a bullish bias on XDC. XDC is ranked third in net buying volume among top trending assets, following Hedera Hashgraph (HBAR) and XRP. 83.5% of trades are buy orders, with only 19% sell pressure.
This data suggests that retail and institutional participants are accumulating and positioning themselves. However, one of the most interesting altcoins is XDC, which outperforms Bitcoin (83.56 % buying) and Stellar Lumens (83.57%).
This token is ranked as one of the most demanded altcoins across the exchanges tracked. Typically, before more momentum, the persistent buy-side dominance patterns allow buyers to support the zones until even minor retracements.
4-Hour Chart Shows Box Consolidation After Impulse Move
From another perspective, this also deals with current price behaviour, but in a shorter time frame (4h chart). Following a strong upward rally between April 10th and 15th, XDC entered a descending correction phase.
This correction is expected to transition into horizontal consolidation by May 10th. The light blue area marked above is a consolidation zone between about $0.070 and about $0.072. There, candlesticks show low volatility and less spread.
Typically, this behavior results in a breakout aligning with the initial trend. In this scenario, the trend points toward a bullish continuation.
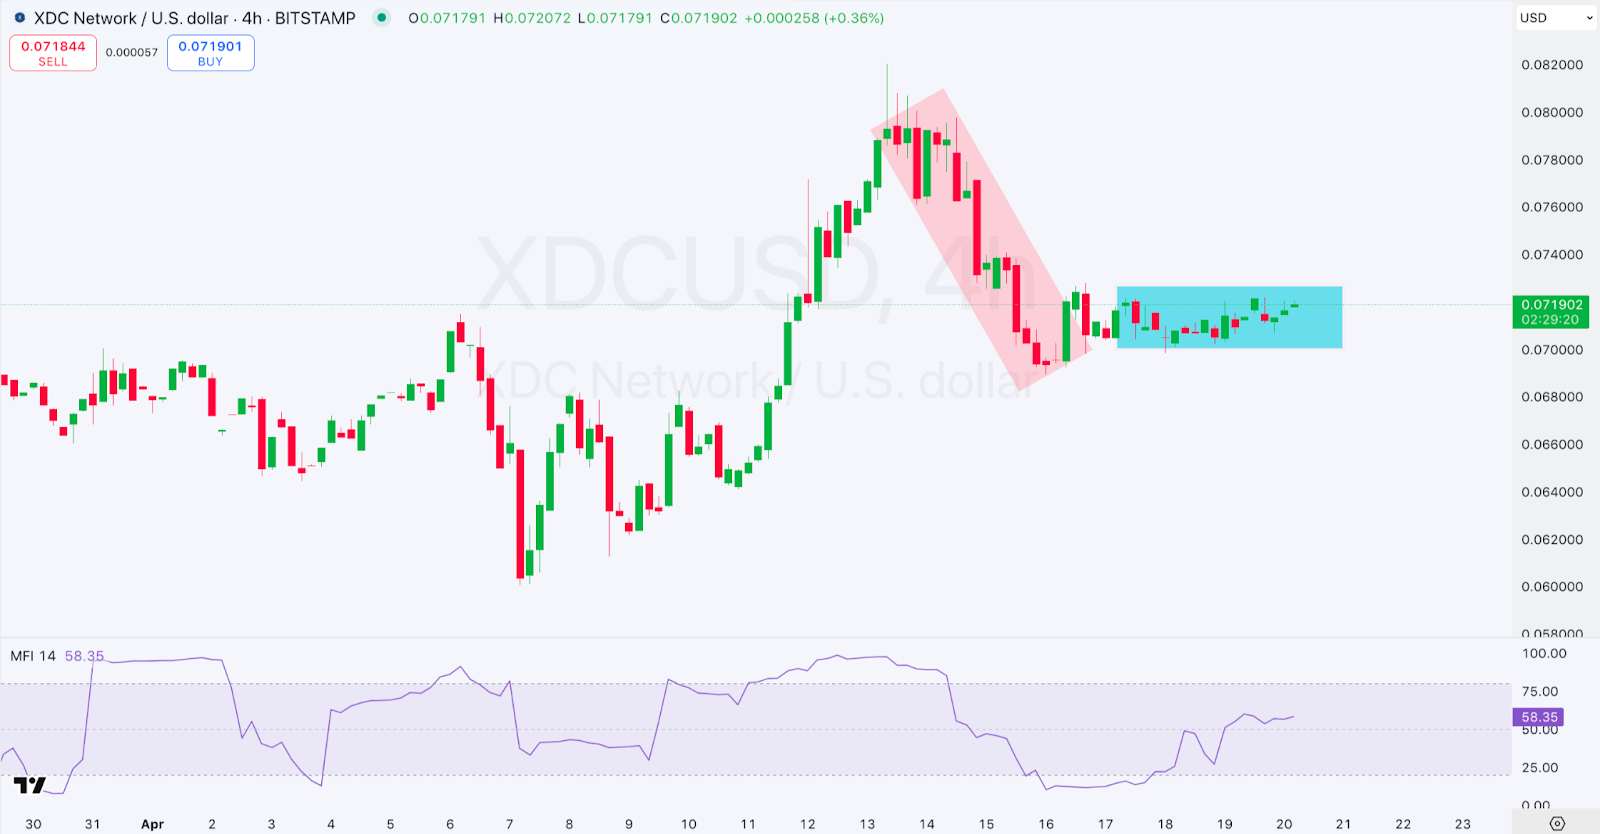
The Money Flow Index (MFI 14) is 58.35, above the centre point of 50, indicating that capital influx remains positive. It is not overbought as there is still upside potential without the immediate risk of a reversal because of exhaustion on RSI.
Bulls that can get price out of this range with renewed volume could rip fast, but it’s $0.09 as the big ol’ magnet to target.


