XRP Price Prediction: Can XRP Surpass $3 as Golden Cross Looms?
Key Insights :
- XRP’s 200 moving average was about to collide with the 20 and 50 MAs, suggesting a potential big move could be coming.
- Long/Short Taker Volume showed the longs in the tune of 53.89% of the taker volume to the shorts’ 46.11%.
- The crowd value was 2.66 while the smart money ended at 0.21, which were behind the bullish region.
On the weekly XRP price prediction chart, the altcoin traded in a descending channel, with the price at $2.11 below the 20-week EMA of $2.17 as well as the 50-week EMA of $2.18.
XRP Price Prediction
The other level to note was that the 200 MA at $2.06 was closing in on both the 20 & 50 EMAs, which was a sign of volatility breakout in either direction.
Should XRP price remain stronger above the $2.06 and re-attempt to cross above $2.17, it could break out from the channel, targeting $2.60, $3, or higher levels.
This would result in the actualization of the potential Golden Cross from the three EMAs.
However, a breakdown towards $1.80 or the wedge formation’s base at $1.50 could result from a closure below the 200 MA.
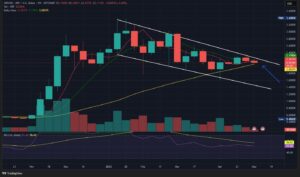
The volumes remained low, showing that more investors seemed to be building their positions or were still in a state of confusion.
This was while the RSI was at 56.62, indicating that there was potential upside but not very charged up.
The wedge pattern meant that there was an increase in pressure, and the longer one stayed near the apex, the bigger the move could be in the breakout.
Investor should begin to watch price action above $2.20 to signal a continuation of the uptrend. However, a closing below $2.00 could be a signal of resuming bearish pressure.
Its multi-month structure remained sideways until one of those levels ceded with volume back it.
XRP Price on Long/Short
Long/Short Taker Volume showed the longs in the tune of 53.89% of the taker volume to the shorts’ 46.11% giving a long/short ratio of 1.1687.
This may suggest that traders were becoming more inclined to go for upside positions, albeit not completely overboard.
Such ratios may imply that the fundamentals were not that strong but market sentiment was optimistic; a change of mindset or instability could easily turn the tables around.
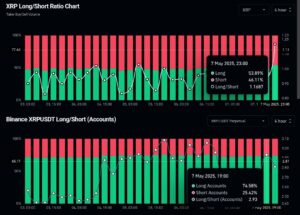
At Binance, long account dominance had been more apparent long before the hack was discovered and publicized.
As of press time, long accounts increased to 74.58% while short accounts were 25.42%, resulting to a long/short account ratio of 2.93.
This showed that retail participants were very much so geared toward taking on long-only positions on the price.
In fact, depending on how long these ratios go, there was a high risk to be taken if this went through a reversal.
XRP’s Participants’ Sentiment
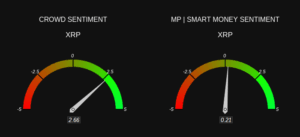
In the sentiment part of analyzing the XRP, there was quite a discrepancy in the sentiment between the crowd as well as the smart money.
The crowd value was 2.66, which is behind the bullish region, meaning that retail traders are getting more optimistic on the market.
On the other hand, the smart money sentiment ended at 0.21, a sign that institutional investors were either lukewarm or waiting for further confirmation before going all out.
This may show that the retail trader was expecting that a stock would spike whereas institutional traders were not much interested in the stock.
If hope and excitement increases without any follow through with actual investing by smart money, it could create a bubble that may be met with resistance or a dip.
But if smart money sentiment approaches or goes above 2.5, this would actually support the idea that retail sentiment was correct and we could see further increase in the value.
On the opposite, if both become negative, then it might indicate that XRP was in a bearish trend.


